Research — Nov 19, 2026
Graphite's hidden economics: From geology and flake size to the cost curve
By Jason Holden and Dyan Sy
Graphite is the largest component by weight in a lithium-ion battery anode, and every electric vehicle on the road depends on it. By late 2025, battery demand had overtaken steel as graphite's single largest end-market. The journey from rock to flake is straightforward: Ore comes from an open-pit mine, which then passes through a flotation plant and a series of high-temperature processing steps to produce a battery-grade particle that a cell maker will accept. In this article, we discuss the steps for creating graphite concentrate and how grade, flake size, processing requirements and operating costs shape a project's position on the cost curve.

- Graphite is essential to lithium-ion battery anodes, and battery demand has become the mineral's largest end-market.
- Supply risk is most prevalent in processing, rather than geology. Graphite deposits are widespread, but China dominates mining, midstream processing and synthetic graphite production.
- Project economics depend on more than cash costs. Flake size, carbon purity and product mix can materially affect realized prices and a mine's position on the cost curve.

The world's major flake graphite deposit belts reflect a metamorphic origin. The Mozambique Mobile Belt, the Canadian Shield and the cratonic basement of northeastern China host the largest known concentrations of high-grade flake graphite. What makes a deposit worth mining is a combination of grade, flake size and geometry. Geometry matters because flake graphite bodies are often tabular and stratiform; they lie in flat, near-surface layers that suit open-pit mining. Folded or steeply dipping bodies require more careful extraction methods to maintain economic strip ratios.
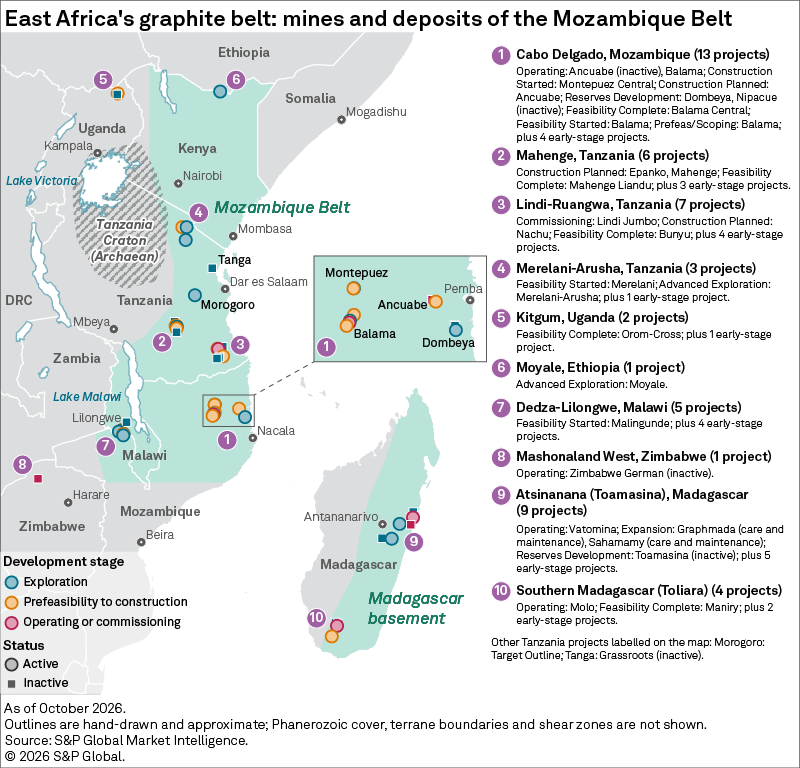
This map shows why East Africa has become an important region for natural flake graphite development. Graphite projects are spread across a broad geological terrain, extending from Mozambique through Tanzania and toward Uganda and Ethiopia, with additional clusters in Malawi, Zimbabwe and Madagascar. But shared geology does not mean shared economics. Projects across the belt differ considerably in grade, flake-size distribution, deposit geometry, infrastructure and development stage — all of which ultimately influence their position on the cost curve.
Grade and quality: What do the numbers say
Graphite's value in a battery anode depends on two independent measures: grade and flake size. Understanding both is essential to evaluating any deposit.
Grade is measured as total graphitic carbon (TGC), the proportion of actual graphitic carbon in a metric ton of ore. Run-of-mine (ROM) ore typically ranges from 3% to 18% TGC globally: Nouveau Monde Graphite Inc.'s Matawinie in Canada sits at about 4.5%, Syrah Resources Ltd.'s Balama in Mozambique at 16%-20% and Walkabout Resources Ltd.'s Lindi Jumbo in Tanzania at 11%-21%. ROM ore is generally not salable. After flotation, the concentrate is upgraded to a commercial benchmark of 94.0%-96.5% graphitic carbon (Cg) — graphite ore grades are commonly reported as TGC, while concentrate specifications are typically expressed as Cg. Only then is it further processed to achieve a purity of greater than or equal to 99.95% Cg, required for battery-grade anode material.
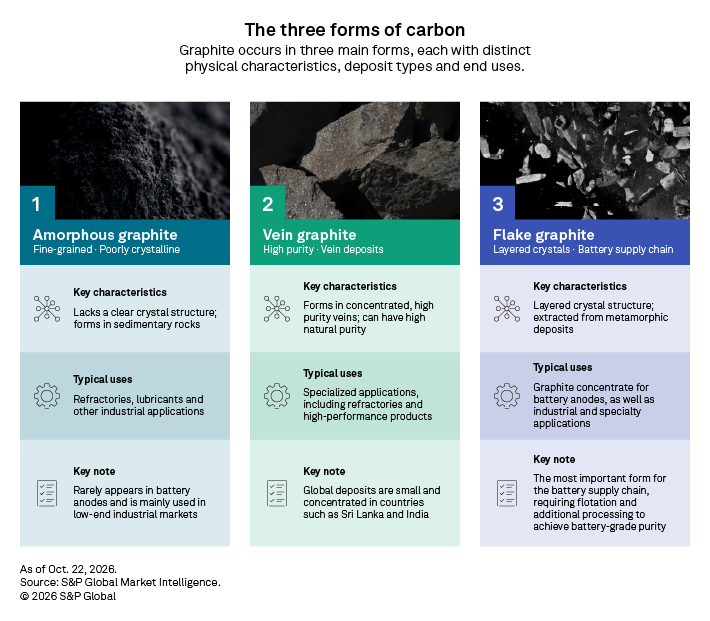
Flake size is classified by mesh, which is the number of openings per linear inch in a sizing screen. A lower mesh number means a larger opening and therefore a larger flake (see infographic below). Jumbo flake commands premiums in expandable graphite and aerospace applications. Large flake is used in flame retardants and refractories. Medium and fine flake serve as the primary feedstock for battery anodes. Anode manufacturers use fine flake specifically because it minimizes the energy required for the micronization step before spheronization.
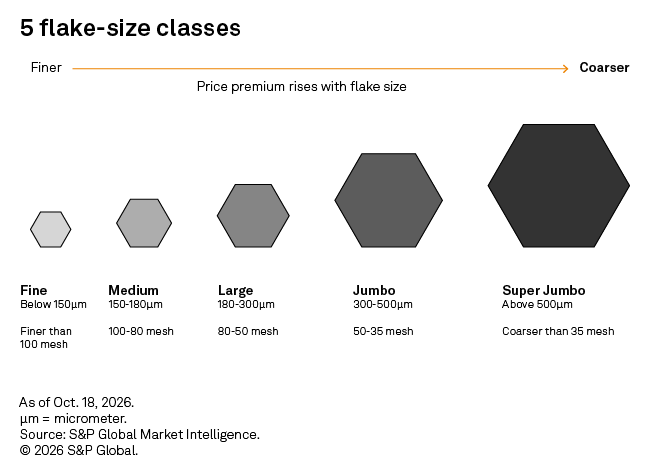
Grade and flake size are independent properties. A high-TGC ore body may yield predominantly fine-flake material, and a low-grade ore may contain a high proportion of jumbo flake. The economics of a project depend on both simultaneously.
Open-pit mining: How graphite comes to surface
Flake graphite's tabular, near-surface geology makes open-pit mining the dominant extraction method. In many deposits in Africa, the ore lies within deeply weathered saprolite, a soft regolith that requires no blasting. Free-dig operations often use bulldozers and front-end loaders rather than explosives, which lowers costs and simplifies permitting. Harder, unweathered rock at depth requires the conventional drill-and-blast method, with careful blast design to avoid shattering large flakes.
From pit to concentrate: The flotation plant
Ore from the mine must first be upgraded to produce a salable graphite concentrate. After crushing, the ore is progressively ground to liberate the graphite from the surrounding waste minerals while minimizing damage to the flakes. Preserving flake size is important, as larger flakes can command higher prices in some end-markets.
The liberated graphite is then recovered through froth flotation, which takes advantage of its naturally hydrophobic properties to separate it from the gangue. Collectors, such as kerosene or diesel, improve graphite recovery; frothers, such as methyl isobutyl carbinol (MIBC), help maintain a stable froth; depressants, such as sodium silicate, can also be used to suppress silicate gangue. The material typically passes through the rougher, scavenger and multiple cleaner stages, with intermediate regrinding used to further liberate graphite and remove impurities. This progressively raises the carbon grade while balancing recovery against the need to preserve valuable flake size.
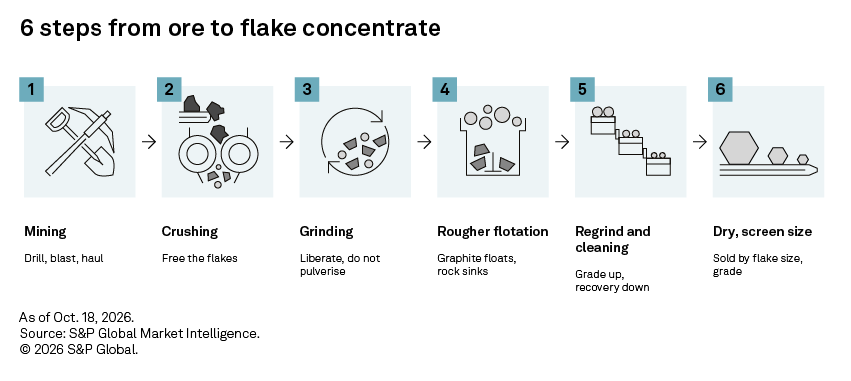
Overall graphite recovery through the flotation circuit typically ranges from 85% to 96%. The resulting concentrate is dried, screened into different flake-size fractions and bagged, typically at about 94.0%-96.5% Cg. This concentrate is a salable product, but it is not yet battery-grade anode material. For battery applications, it must undergo further processing, including micronization, spheronization, purification to more than or equal to 99.95% Cg and, ultimately, coating before usage in the anode.
Cost curve and the China discount
The cost curve is the simplest way to understand why China's dominance in natural graphite production is entrenched. China's largest mines, Yunshan and Beishan, cluster at roughly $220-228/mt. Balama in Mozambique, the world's largest single graphite mine, sits at a much higher price of about $575/mt. Upper-quartile producers in Norway, Canada and Brazil incur costs above $600/mt, with some approaching $1,600/mt.
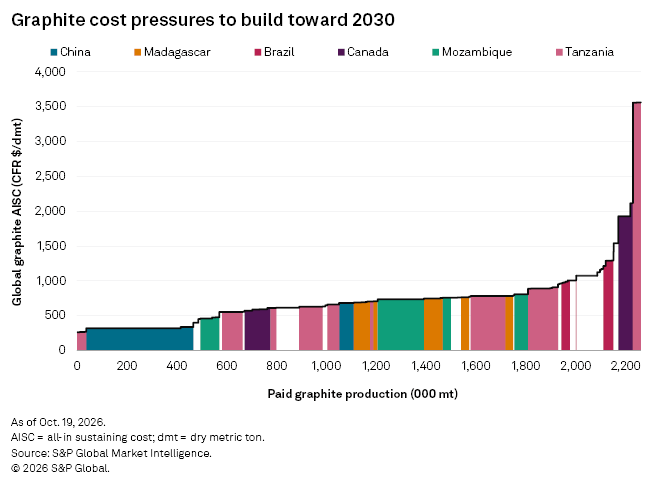
Current prices are roughly $450/mt FOB China — a level at which most operations outside China are producing at or below their total cash costs. Under our consensus forecast, average graphite cash costs will rise about 32% to $574/mt by 2030 from $435/mt in 2026. This increase is broad-based across labor, energy and royalty costs. However, the rise in average cash costs reflects not only underlying cost escalation but also the addition of new projects that are expected to operate at higher costs than the mines currently covered by S&P Global by 2030. This is not a sustainable position; mines in Africa and Australia can only survive with strategic offtake agreements, additional revenue streams or government support.
Reading the cost curve: Quality adjustments
A mine's cash cost is only half the story. Because graphite deposits produce different mixes of flake sizes and carbon purities, analysts normalize the cost curve using a quality adjustment. This step can materially reorder a mine's competitive position.
The formula is straightforward: Quality cost adjustment equals to the benchmark price subtracting the mine's realized price. A mine whose product commands a premium above the benchmark receives a cost credit, which means its adjusted position on the curve moves lower, reflecting the superior margin its ore generates. A mine whose product sells at a discount to the benchmark receives a cost penalty, which means its adjusted position moves higher, even if its pit-to-gate cash cost appears low.
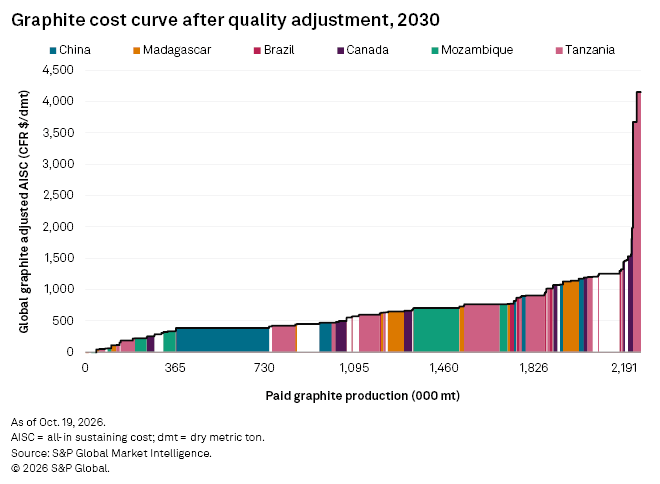
Three physical characteristics drive the size of the adjustment. Flake-size distribution is the most important: Jumbo and large flakes command significant premiums in refractories, expandable graphite and specialty markets, while fine flakes sell at a discount and are the lowest-value fraction of the concentrate. A deposit dominated by fine material will carry a cost penalty, regardless of its nominal total cash cost. Carbon purity matters at the margins: The industry benchmark for standard flotation concentrate runs at 94%-95% Cg. Material falling below 94% Cg attracts steep pricing penalties, while concentrate consistently exceeding 95% Cg through straightforward flotation earns a premium. Purification and value-added costs are the third lever: Upgrading concentrate to battery-grade spherical graphite (more than or equal to 99.95% Cg) requires chemical or thermal purification that adds substantial capital and operating costs that must be offset. Integration is economically justified only when the price premium for the finished anode material more than compensates for those costs.
Headline cash costs do not necessarily indicate where a producer sits competitively. A mine producing a high proportion of fine flake may move higher up the cost curve, once its lower realized product value is considered, while a higher-cost producer with greater exposure to large and jumbo flake may improve its relative position.
From resource abundance to supply security
Graphite is geologically abundant, with global reserves estimated at about 310 million mt of contained graphite. However, abundance in the ground does not automatically translate into supply security. The challenge lies in the journey from graphite locked in metamorphic rock, through mining and flotation, to a battery-grade material that meets the specifications required by anode manufacturers and cell makers. Three factors determine whether it can do so: deposit quality, jurisdiction and midstream capability. Grade, flake-size distribution and strip ratio shape the mine's economics. For producers outside China, developing these capabilities while remaining cost-competitive will be critical to securing a place in the battery supply chain.
Ultimately, graphite supply security will depend not only on developing new mines, but also on building the processing capacity needed to turn those resources into commercially viable battery material. For graphite, the supply chain bottleneck is not simply finding the resource, but producing the right material at a cost the market can sustain.
This article was published by S&P Global Market Intelligence and not by S&P Global Ratings, which is a separately managed division of S&P Global.