Research — October 14, 2026
Interactive Brokers forecast to report 12% YOY increase in Q3 revenue
By Venkatkumar Raju
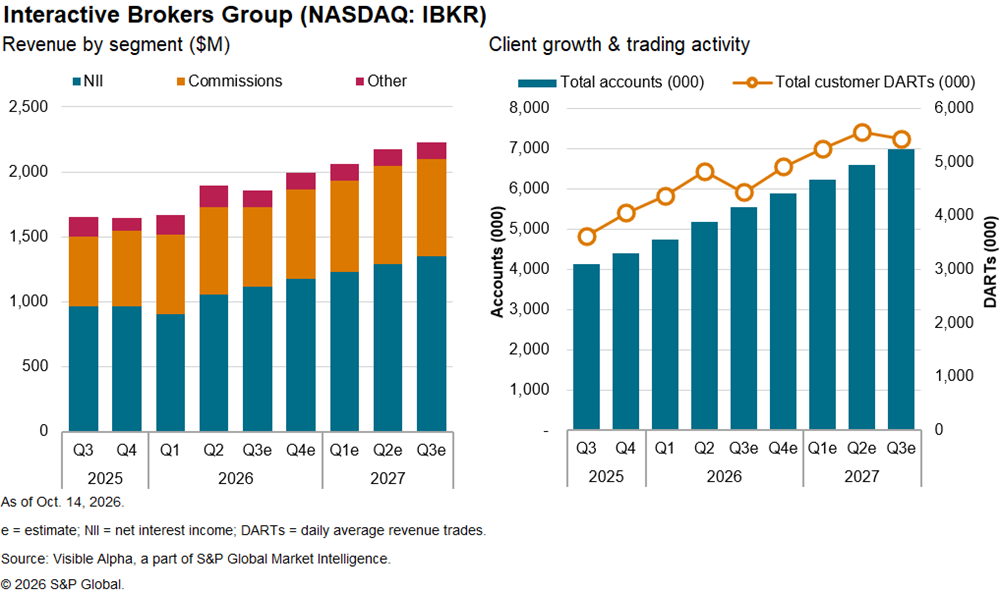
US-based Interactive Brokers Group Inc., trading as IBKR on the Nasdaq, is scheduled to report third-quarter results on Oct. 15, with Visible Alpha consensus estimates indicating that the electronic brokerage firm's revenue will be up year over year but remain largely flat quarter over quarter.
Interactive Brokers' third-quarter revenue is forecast to reach $1.85 billion, compared with $1.89 billion in the second quarter, and up 12% from the prior-year period, driven by higher net interest income and increased client assets.
Net interest income is expected to rise 15% year over year to $1.12 billion, supported by customer balances and margin lending. In the second quarter, net interest income rose 23% from the prior-year period to $1.06 billion, primarily on higher average customer margin loans and customer credit balances.
Commission revenue is projected to reach $619 million, a 15% increase from the third quarter of 2025 but an 8.0% decrease compared to the previous quarter.
Recent brokerage metrics point to some moderation in trading activity. Interactive Brokers' daily average revenue trades fell 4% month over month to 4.1 million in September, although the figure remained well above year-earlier levels. For the third quarter, Visible Alpha consensus forecasts daily average revenue trades at 4.4 million, up 23% year over year but down 8% from the previous quarter.
The client base is expected to continue expanding. Total accounts are expected to increase 35% year over year to 5.6 million, while customer equity is projected to grow 29% to $974 billion.
The upcoming results will offer a read on whether continued growth in client assets and interest income can offset softer sequential trading activity and sustain the brokerage’s high profitability.
Visible Alpha is a part of S&P Global Market Intelligence. Full Visible Alpha data is available only via subscription. For more information or to express your interest, please contact your S&P Global Inc. relationship manager.
This article was published by Visible Alpha, part of S&P Global Market Intelligence and not by S&P Global Ratings, which is a separately managed division of S&P Global.
Content Type
Products & Offerings
Segment
