Research — Oct 08, 2026
Cheap ore, costly chemistry: Repricing the iron ore cost curve
By Cesar Pastrana and Jason Holden
The traditional value-in-use (VIU) model based on chemical properties is being boosted by the global push for decarbonization. This is changing in the iron ore market, separating high-grade, low-impurity ores from the lower-grade majority. These VIU adjustments are reshaping the cost curve, altering the competitive position of producers across the industry.

➤ Decarbonization widens VIU spreads, with expanding premiums for high-grade feedstocks bifurcating the iron ore market.
➤ Impurity penalties alter cost competitiveness. Adjusting cash costs for VIU reduces the margin of lower-quality products.
➤ The shift toward to direct-reduced (DR) iron production raises required incentive prices, and capitalizing new DR-ready mines requires higher long-term benchmark pricing to meet downstream low-carbon steel demand.
➤ Simandou's real ranking is determined by VIU, not cost. Although it ranks in the middle of the cash-cost table, it is top-tier on chemistry, the basis on which it competes with Australian supply.

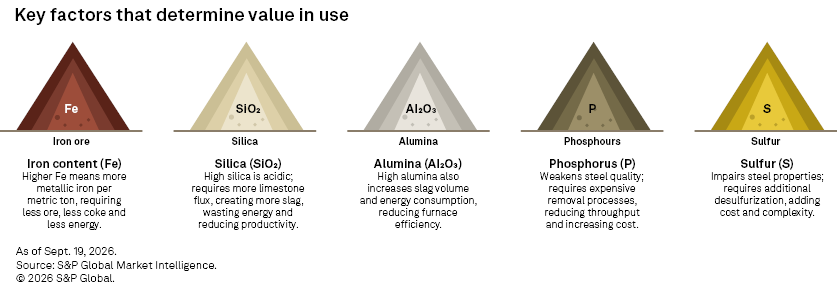
In simplest terms, value-in-use is the total economic value an iron ore delivers to a steelmaker's specific blast furnace, calculated as the cost savings or additional profit it generates compared to a benchmark iron ore. It is a holistic, dynamic and customer-specific metric that moves beyond just the price or the headline iron content. The principle is simple: Not all iron is created equal.
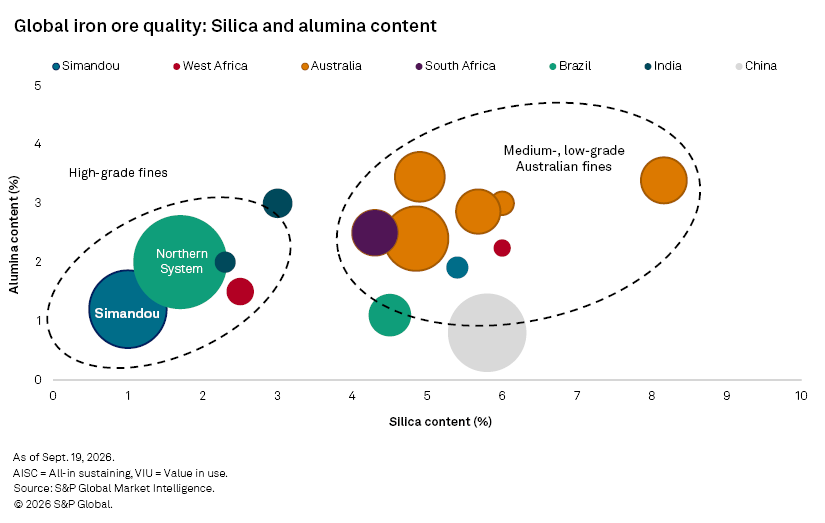
The chart below demonstrates a clear trade-off in impurity profiles among global iron ore products, highlighting Northern System in Brazil and Simandou Blocks 3 & 4 in Guinea as the premier high-grade regions due to their exceptionally low silica (less than 3%) and low-to-moderate alumina levels. In contrast, major fines producers in Australia cluster in the medium-to-low-grade segment, with significantly higher levels of silica (4%-9%) and alumina (2%-4%). Chinese domestic fines occupy a niche, offering moderate silica but maintaining a relatively low alumina profile. This highlights how geographic origin and geology dictate the purity of iron ore, separating premium, low-impurity feedstocks from more abundant, lower-grade alternatives.
Why is the cheapest ton not the most competitive
A traditional mining cost curve ranks mines from lowest to highest cost, plotting each as a block with a width proportional to its annual output. The resulting supply stack shows the producers with the lowest costs on the left, marginal producers on the right, and the price at which a given share of global supply turns unprofitable.
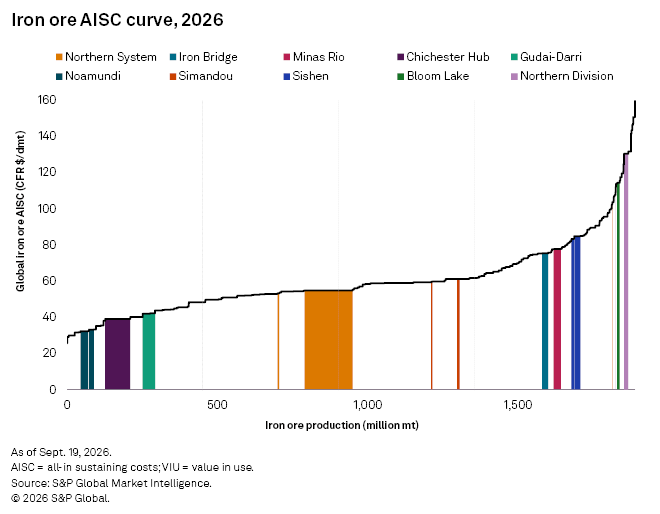
The VIU iron ore cost curve is very similar, but it also includes deleterious elements, such as silica, alumina and phosphorus. Using Platts differentials, we can then determine the true economic value of the iron ore at the blast furnace. Platts is part of S&P Global Energy.
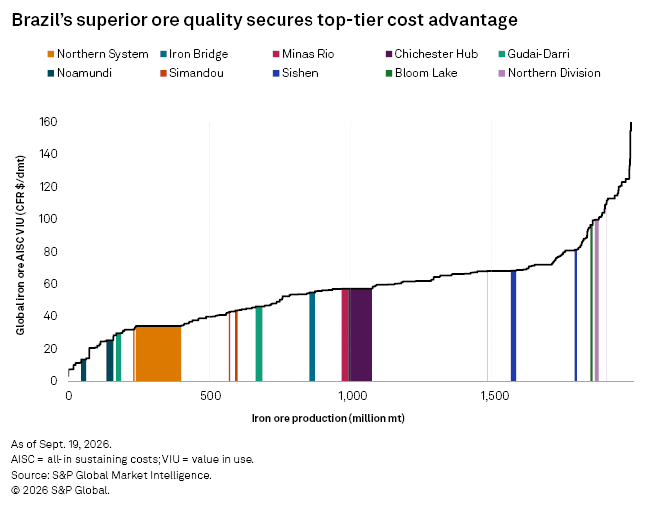
Our sample of 10 mines shown in the chart above spans seven countries, with cash costs of $33 per dry metric ton to $130/dmt, and a range of products from high-moisture low-grade fines through to high-grade pellets suitable for DR. Three selections are particularly significant. Chichester Hub and Iron Bridge share an operator, a port and a freight route, but sit $36/dmt apart on a nominal basis, with product specification and processing pathway as the differentiating variables. Gudai-Darri, close to the 62% Fe reference specification, anchors the comparison. It is clear to see how projects can move up and down the cost curve based only on their ore grades.
What turned chemistry into a cost problem
– BHP Group Ltd. and Rio Tinto Group have lowered iron ore fines and lump specifications, as ore quality weakens across their Pilbara operations. The Platts IODEX specification downgrade to 61% from 62% Fe effective Jan. 2, 2026, is a formal acknowledgment of a multiyear drift, with Fe content falling and alumina and silica rising across key Australian brands. Pilbara Blend Fines has moved to 60.8% from 61.6% Fe, Newman High-Grade Fines to 61.2% from 61.7% and Mining Area C Fines to 60.5% from 60.8%, with Jimblebar Fines also declining since mid-2024. Each shift is a small reduction in VIU per metric ton, but across Pilbara's shipped volumes, the cumulative economic impact is significant, and the spread between premium and standard products widens as the specifications of the industry's highest-volume producers edge down.
– Fortescue Ltd. maintains its roughly $10-12/dmt cost advantage over Rio Tinto and BHP, and all three companies remain comfortably profitable at current prices. But the declining trend in grades is unfavorable, and as VIU-adjusted procurement becomes more sophisticated at Chinese mills, the discount on lower-quality Pilbara material will widen. The response to higher-grade product development, via investment and acquisition of higher-grade deposits, is underway but will need to accelerate.
– When shipping costs rise, every ton of ore carries the same logistics burden regardless of Fe content. Each ton of 65% Fe delivers more iron to the mill for the same freight spend as a ton of 61% Fe; the efficiency gain is fixed regardless of freight markets. In a period of elevated freight costs, the advantage of high-grade ores increases.
– Emissions scrutiny on steel mills is increasing. The global push for decarbonization is increasing the importance of traditional VIU. High-grade ore reduces coke consumption and slag generation, directly lowering the CO2 intensity of hot metal production. As carbon pricing schemes, such as the EU's Carbon Border Adjustment Mechanism, make the emissions cost of steelmaking explicit, the value of lower-impurity ore becomes bankable, not just operational.
How the advantages of high-grade ores compound
The clear winners are producers with ore bodies capable of delivering high-grade, low-impurity material. In a period of elevated freight costs and tightening emissions scrutiny, this category's advantage is compounding: The same ton that reduces a Chinese mill's coke, flux and energy inputs also arrives with a lower carbon cost per unit of iron.
Vale SA's mines in the Carajás system are the archetype, with a consistently high Fe content, low impurity levels, and a brand premium validated by VIU analysis. Despite Vale's freight disadvantage on the long Brazil-China route, Carajás-grade material from operations such as Northern System commands a persistent market premium that reflects its operational value to steel mills. As decarbonization pressure intensifies, that premium will be more explicitly anchored to CO2 savings.
Simandou sits in this category by virtue of its ore quality. At 65% Fe with low impurities, it secures a top-tier position on the VIU-adjusted cost curve, substantially different from its mid-table ranking on a simple total-cash-cost basis. It is VIU, not FOB cost, that determines Simandou's competitiveness relative to Australian supply.
DR-grade pellet producers represent an even more privileged position. Specifications for DR-grade material (typically 67% Fe or above) are so demanding that quality ore bodies are constrained. The VIU premium already reflects this scarcity, and demand will grow as the construction of low-carbon steel projects in Europe and the Middle East proceeds.
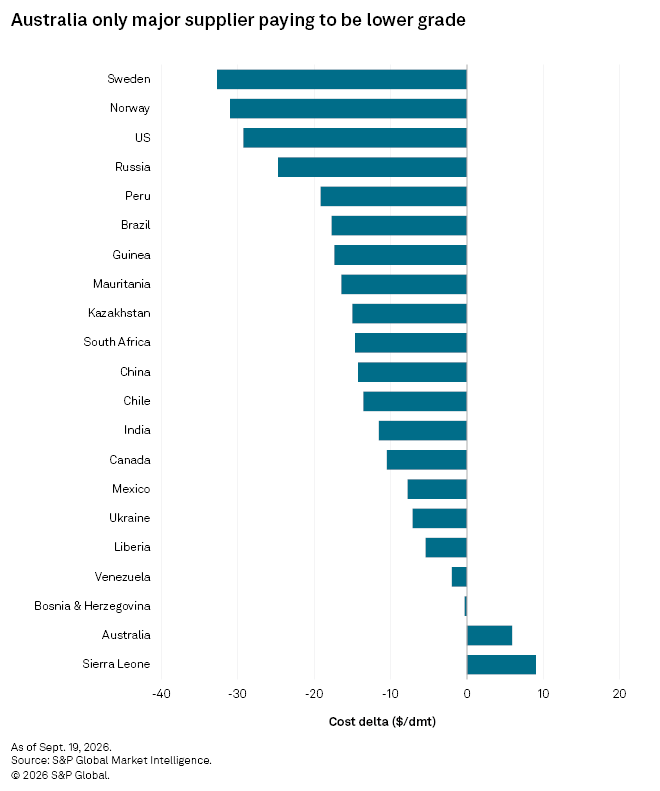
Aggregating the VIU adjustment to the country level makes the contrast unmistakable. The difference shown is VIU-adjusted all-in sustaining costs (AISC) minus reported AISC. Positive means the ore's chemistry imposes a net cost on the buyer, raising the producer's true cost position; negative means the ore earns a net credit and the producer's real standing is better than its headline cash cost implies. Of 21 producing countries, only Sierra Leone ($9.02/dmt) and Australia ($5.90/dmt) carry a meaningful penalty.
Of these two, Australia matters much more. Roughly 927 million mt of annual seaborne supply is expected to come from Australia in 2026 at a US$40.67/dmt. Carrying a $6/dmt chemistry penalty is a materially different position in a key criterion that actually governs a Chinese mill's procurement decision. And the January 2026 IODEX specification means that the penalty widens rather than narrows.
At the other end, Sweden, the US and Russia reflect magnetite concentrate and pellet operations that feed premium and DR-grade markets. At the same time, Brazil and Guinea represent large-scale, low-impurity hematite operations. Brazil's credit is significant, delivered at volume and largely offsetting Vale's Atlantic freight disadvantage.
Conclusion
The cost curve that matters is no longer the one denominated in dollars per metric ton at the mine gate. Adjusting for chemistry reorders it, and the asymmetry of that reordering is the story: Of 21 producing countries, only two carry a meaningful penalty, with one of them supplying the majority of seaborne volumes. Australia's approximately 927 million mt of 2026 supply absorbs a $6/dmt chemistry cost that its headline AISC conceals, while Brazil's and Guinea's credits are large enough to neutralize an Atlantic freight disadvantage.
Using VIU leads to a convergence of the buyer's and the seller's rationales. Mills use VIU to set premiums, discounts and burden blends, because higher-grade feed lifts furnace productivity and lowers delivered cost per metric ton of steel. Miners use it to defend the realized price. Both arrive at the same conclusion: Grade, not volume, increasingly determines margin.
Three forces will widen the split. The January 2026 IODEX specification change formalizes a drift already several years old. Carbon pricing makes the emissions cost of impurities explicit and bankable rather than merely operational. And DR-grade demand means that value is concentrated at the top of the curve, where qualifying ore bodies are scarce enough that new supply will require higher long-term incentive prices than the current benchmark supports. Pilbara producers are not in distress — the operations of all three majors are comfortably economic. But they are competing on a basis where their advantage erodes each year, and the repair work does not keep pace.
This article was published by S&P Global Market Intelligence and not by S&P Global Ratings, which is a separately managed division of S&P Global.