Research — October 28, 2026
Amazon earnings preview: Q3 2026

By Melissa Otto, CFA
Capex overview
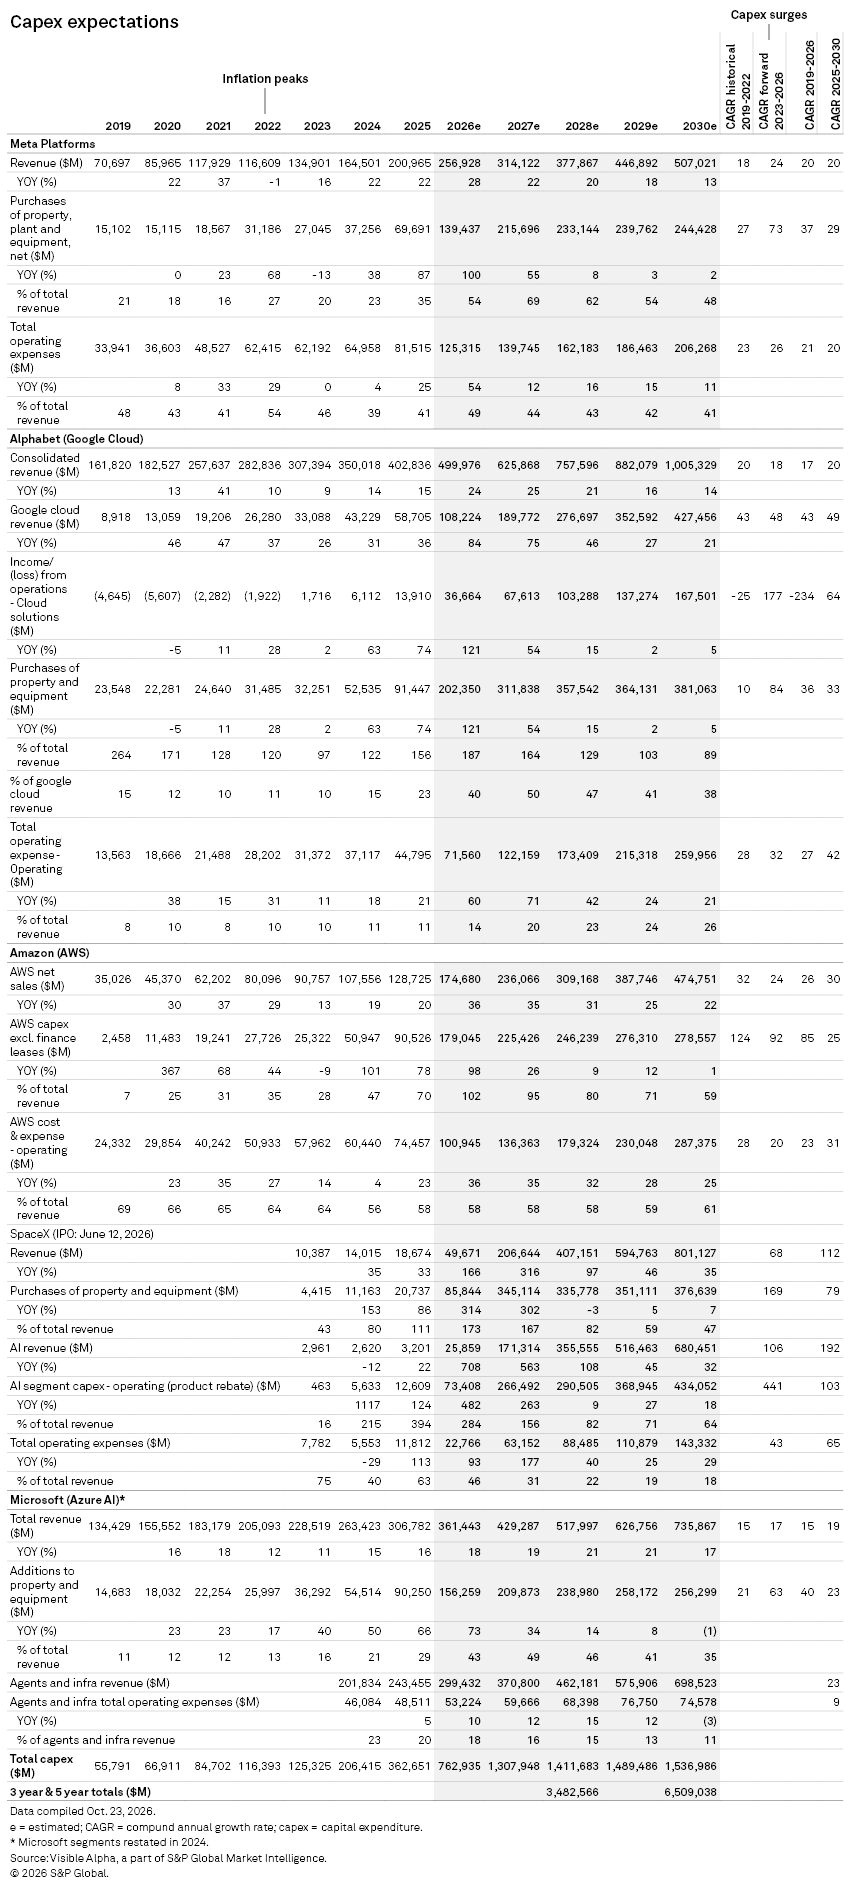
Strong growth in technology infrastructure investment to support AI was a focus over the past year and is projected to expand in 2026 and 2027. Hyperscalers' capital expenditure (capex) expectations have continued to rise. For calendar year 2026, consensus estimates indicate capex will more than double to $762 billion from $362 billion. In 2027, spending is projected to increase further to $1.3 trillion, bringing total spending to more than $2 trillion in only two years. The significant ramp up in spending is projected to outpace revenue growth in the near term, potentially adversely affecting free cash flow. Will Amazon.com Inc. maintain or further increase its capex guidance to keep pace with peers?
Amazon Q3 earnings preview: What's happening to margins?
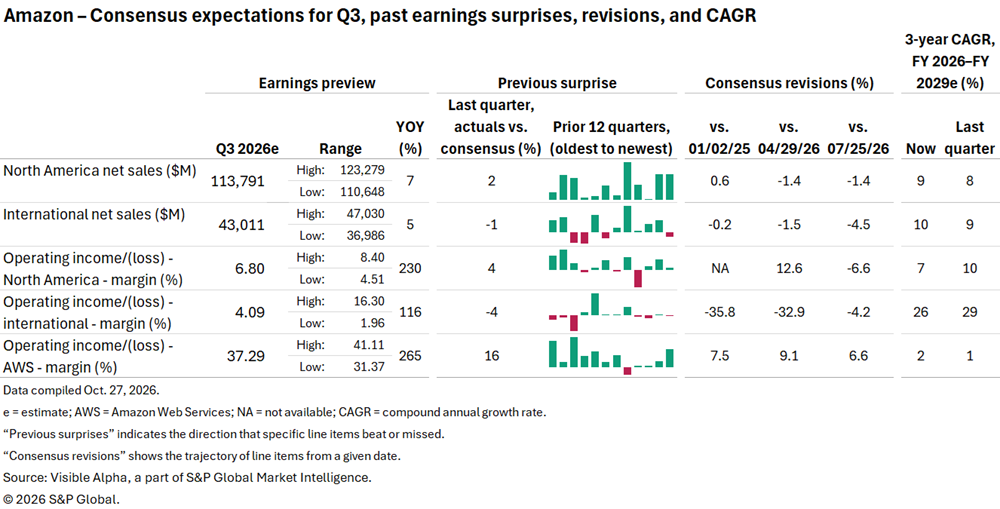
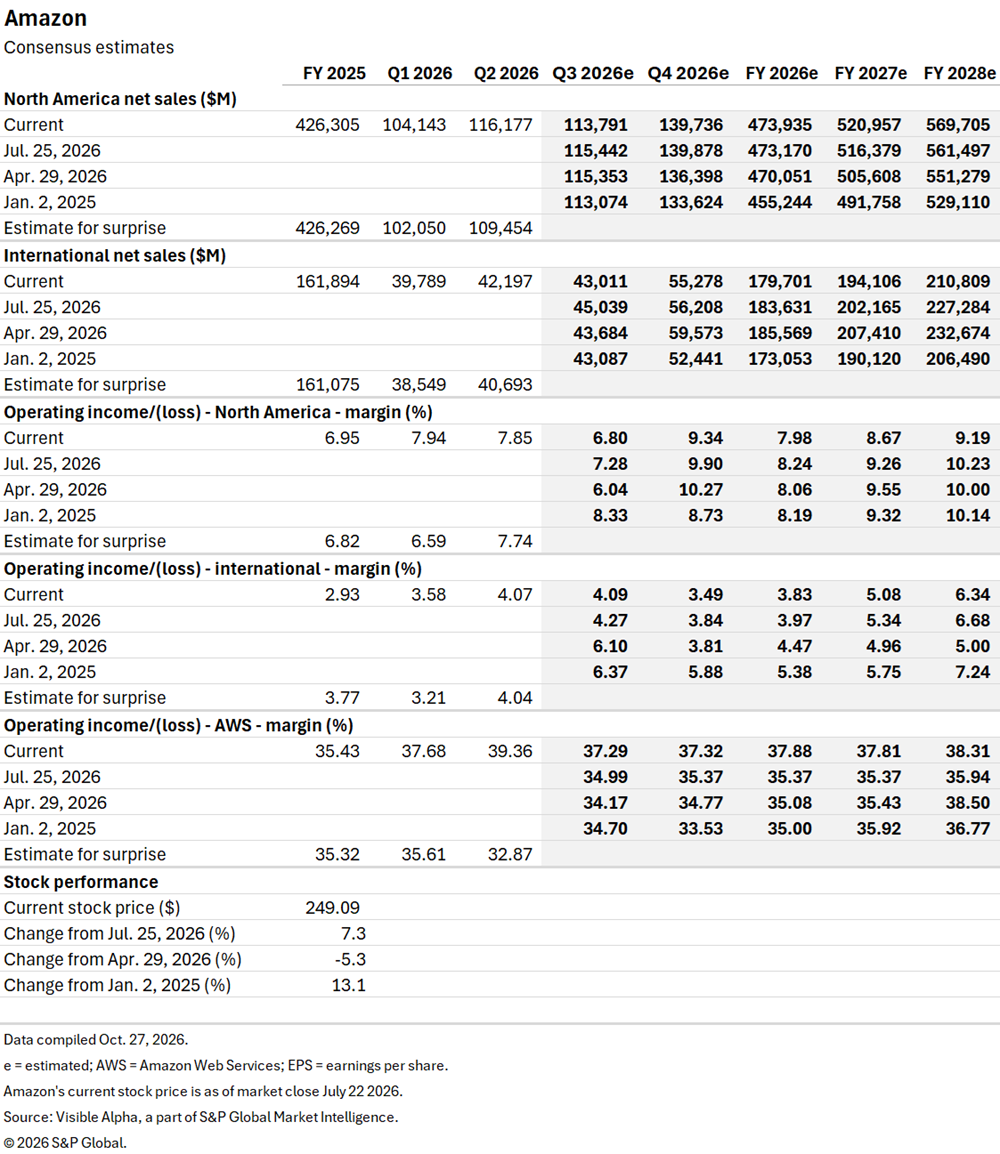
According to Visible Alpha consensus, total North American revenue expectations for the third quarter have edged down to $113.8 billion from the prior quarter. Expectations for the international online retail segment have also softened. The decrease in retail expectations may indicate lower consumer spending amid inflation. Investor attention will likely shift to the performance of the online retail segment during the holiday selling period in the fourth quarter of 2026.
The North American retail operating profit margin has increased significantly from losses a few years ago to an estimated 6.8% for the third quarter of 2026. However, margin expectations for the third and fourth quarters have declined by approximately 50 basis points since last quarter. For the third quarter, the estimated margin range narrowed to 4.5% to 8.4%, with consensus at 6.8%. The international operating profit margin range is more extreme, at 1.96% to 16.3%, with consensus settling at 4.1%. The debate centers on the impact of inflation and tariffs on revenue and margins.
In contrast, consensus for Amazon Web Services (AWS) has increased to approximately $45.4 billion. The AWS margin for the third quarter is expected to be 37.3%. This is up from the 35.0% expected last quarter and 34.2% in April 2026. The range of estimates for the third quarter AWS margin has widened 200 bps to 31.4% to 41.1%, with consensus at 37.3%, likely reflecting differing views and assumptions around the profitability of AI services. For the fourth quarter of 2026 and fiscal 2027, AWS margins and their impact on earnings per share (EPS) growth will likely be in focus, as expectations have also increased since last quarter.
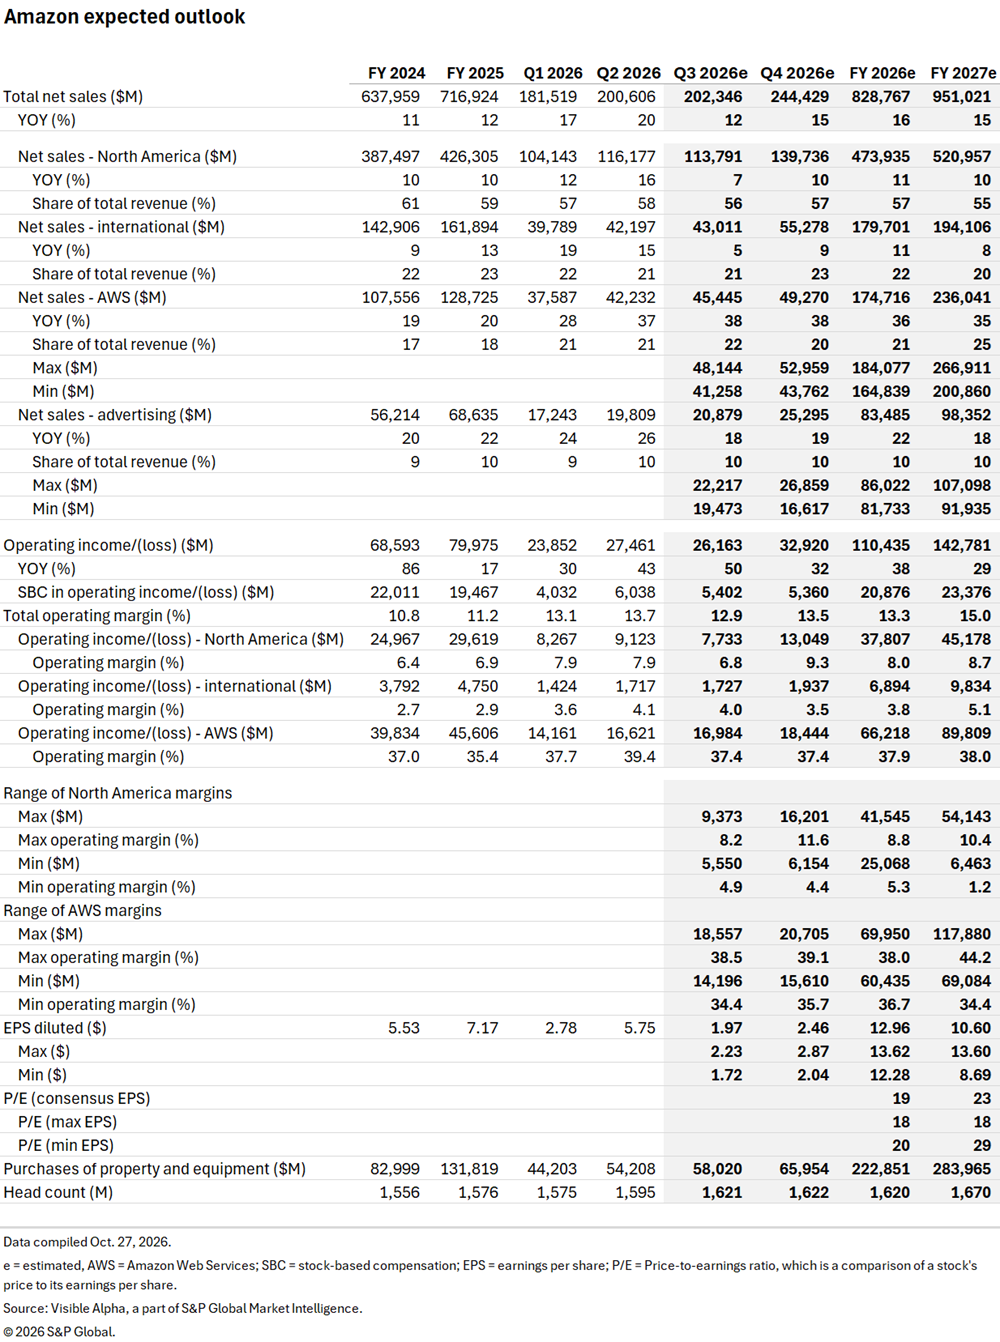
We are closely watching the company's guidance for the fourth quarter of 2026 and its commentary on AI investments, as fiscal 2026 capex estimates have continued to increase. Consensus estimates show capex has expanded more than fivefold from $52.7 billion in fiscal 2023 to an expected $284 billion in fiscal 2028. Given the current backdrop and increasing memory and chip prices, questions remain as to whether the company will raise its full-year capex guidance.
The stock is up 12.3% year to date, in line with the S&P 500. The consensus price-to-earnings ratios are 19 times for fiscal 2026 and 23 times for fiscal 2027, driven by a decrease in projected fiscal 2027 EPS due to an estimated lower non-operating profit from investments in Anthropic. The consensus target price of $336 implies a 35% return. Could the third-quarter release provide a catalyst for the stock?
Important notice
Copyright © 2026 by S&P Global Market Intelligence, a division of S&P Global Inc. All rights reserved.
The disclosures, disclaimers, and other important legal information applicable to this material are incorporated herein by reference and available at https://www.spglobal.com/market-intelligence/en/legal/disclosures.
This article was published by Visible Alpha, part of S&P Global Market Intelligence and not by S&P Global Ratings, which is a separately managed division of S&P Global.
Content Type
Products & Offerings

