Research — Sep 25, 2026
US grid congestion intensifies as data centers compound transmission constraints

By Adam Wilson
Renewable energy curtailment continues to accelerate across US wholesale power markets as transmission development struggles to keep pace with generation additions and electricity demand. The six independent system operators with monthly 2026 data (excluding New York Independent System Operator, which does not report monthly curtailment) curtailed 23.8 million MWh of renewable generation through July, about 17.5% higher than the same period in 2025.
The increase follows a modest decline in full-year curtailment in 2025. Across the seven markets, reported curtailment fell to 29.4 million MWh from 30.2 million MWh in 2024. The 2025 total, however, was more than double the 12.4 million MWh recorded in 2020. Congestion costs tell a similar story from a different angle. Excluding California Independent System Operator, which reported an anomalous drop in congestion costs in 2025, the other six markets recorded $11.1 billion in day-ahead congestion costs in 2025, about 33% higher than in 2024.
Curtailment and congestion costs are related but not interchangeable. Curtailment measures generation that could have been produced but was reduced because of transmission constraints, oversupply, or economic signals. Congestion costs reflect the price impact of transmission constraints in the day-ahead market. A region can therefore have substantial congestion without high renewable curtailment, particularly when constraints separate major load centers from lower-cost generation, as in PJM.
An additional data point that helps contextualize regional grid conditions is annual load. Higher electricity consumption does not automatically create congestion if generation and transmission capacity expand alongside it. However, rapid or geographically concentrated demand growth can overload specific substations, transmission paths and generation pockets, even when regionwide load remains manageable. That distinction is increasingly important as AI data center development continues to reshape the pace and geography of US electricity demand.
Hyperscaler power procurement is not alleviating grid constraints
Hyperscalers — specifically Amazon.com Inc., Google LLC, Meta Platforms Inc. and Microsoft Corp. — account for significant shares of regional data center demand growth. These four companies alone have just over 72 GW of data center capacity operating or in development across the US. This does not include more than 100 facilities in planning, for which total utility power is not yet known. To meet this substantial load, these companies are aggressively procuring new generation through long-term power purchase agreements (PPAs) with solar, wind, nuclear, hydro and geothermal plants totaling over 106 GW in the US alone.
Timelines for the physical delivery of power to these assets vary widely, as do their locations. A hyperscaler can contract for wind output in one state while operating a data center behind a constrained substation in another. The company may match annual electricity consumption with renewable purchases, yet the grid must still supply the facility locally during periods of insufficient wind or solar generation. Examining planned transmission lines can help identify where additional transfer capability may better align contracted renewable generation with data center demand.
Despite growing development of transmission and distribution infrastructure, a disconnect remains between the locations of significant data center development and new power generation, complicating the outlook for grid reliability and congestion across the US.
Quantifying ISO grid congestion
The 2026 increase in curtailment has occurred alongside continued load growth. Aggregate load across the markets with comparable data increased by approximately 2% year over year from January through July.
In theory, growing demand should create additional opportunities to use renewable output. In practice, the load and generation are often not in the same place or do not peak at the same time. New solar capacity can deepen midday oversupply, while most data centers require around-the-clock power. Solar and wind resources are frequently located hundreds of miles from the largest demand centers because of their significant land area requirements.
The resulting problem is less a national shortage of electricity than a shortage of infrastructure capable of moving electricity to where and when it is needed. Transmission constraints can leave renewable output stranded in one zone while another zone relies on more expensive generation.
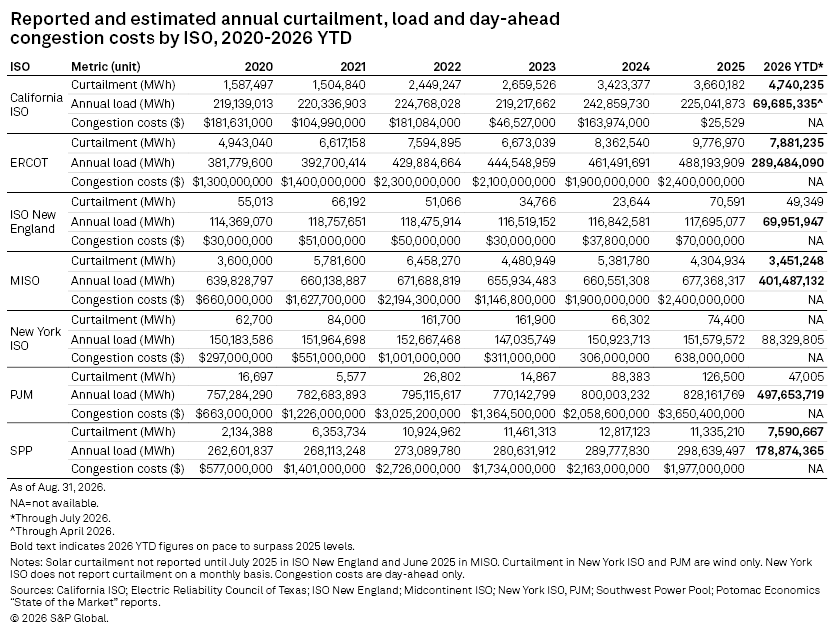
Southwest Power Pool remained the largest source of reported renewable curtailment in 2025, recording 11.3 million MWh. That was down from the 2024 peak of 12.8 million MWh. SPP reported 7.6 million MWh of curtailed wind and solar generation in January to July 2026, on pace to surpass the 2025 total.
SPP's curtailment reflects the rapid growth of wind generation across the central Great Plains, where resource quality is high but local electricity demand is relatively low. Transmission construction has expanded access to larger markets, yet additions to generation continue to strain export capacity.
The market's annual load increased to 299 million MWh in 2025, up from 290 million MWh in 2024. Day-ahead congestion costs declined slightly to $2.0 billion from nearly $2.2 billion, indicating some moderation in transmission-constraint costs, even as renewable curtailment remained high.
The Electric Reliability Council of Texas continues to experience substantial renewable curtailment, as solar, wind and battery capacity expand faster than the transmission system. From January to July 2026, curtailment totaled 7.9 million MWh, 15% higher than the reported curtailment for the first seven months of 2025. Congestion costs also set a new high in 2025 at $2.4 billion, surpassing the previous high in 2022.
West Texas has long exemplified the central congestion challenge: abundant wind and solar resources are located far from the state's largest load centers. Batteries increasingly absorb low-cost generation and shift it to evening hours, reducing local curtailment and price volatility. However, storage cannot replace the need for transmission when bottlenecks persist for long periods.
CAISO curtailed 3.7 million MWh of wind and solar generation in 2025, with solar accounting for the majority. Curtailment through the first seven months of 2026 has already surpassed the 2025 high and is on pace to approach nearly 6 million MWh.
Midcontinent Independent System Operator's footprint includes some of the country's strongest wind resources, fast-growing solar development and large industrial load centers. That geographic diversity creates opportunities for resource-sharing but also imposes persistent constraints on resource flows between generation-rich areas and demand centers.
Reported MISO curtailment declined in 2025 but is increasing again during the first seven months of 2026 and is on pace to set a new curtailment record, thanks in part to MISO beginning to report solar curtailment in June 2025.
The PJM Interconnection is the largest US wholesale power market by electricity consumption, with an annual load of approximately 828 million MWh in 2025. In January to July 2026, load reached roughly 498 million MWh — up nearly 6% from the same period two years earlier. 451 Research by S&P Global forecasts a massive 55 GW of new data center capacity across PJM through 2030, by far the highest among the seven ISOs.
While reported curtailment in PJM remains relatively insignificant, day-ahead congestion costs offer a clearer signal of grid constraints. PJM recorded approximately $3.7 billion in day-ahead congestion costs in 2025, up sharply from about $2.1 billion in 2024 and the highest total among the six markets with comparable data.
Low statewide curtailment does not mean New York lacks congestion. The state has a persistent geographic mismatch between generation resources in upstate and western New York and high demand in New York City and Long Island. Constraints at the interfaces into southeastern New York can produce significant regional price differences without curtailment totals comparable to those of SPP or ERCOT.
ISO New England is a similar case, with curtailment levels relatively low because stranded wind and solar generation are less of a concern in the region. However, some grid congestion remains, as indicated by rising congestion costs. Data center development and related load growth are not anticipated in New England, making transmission constraints less critical than in other regions.
Transmission plans remain concentrated within regional boundaries
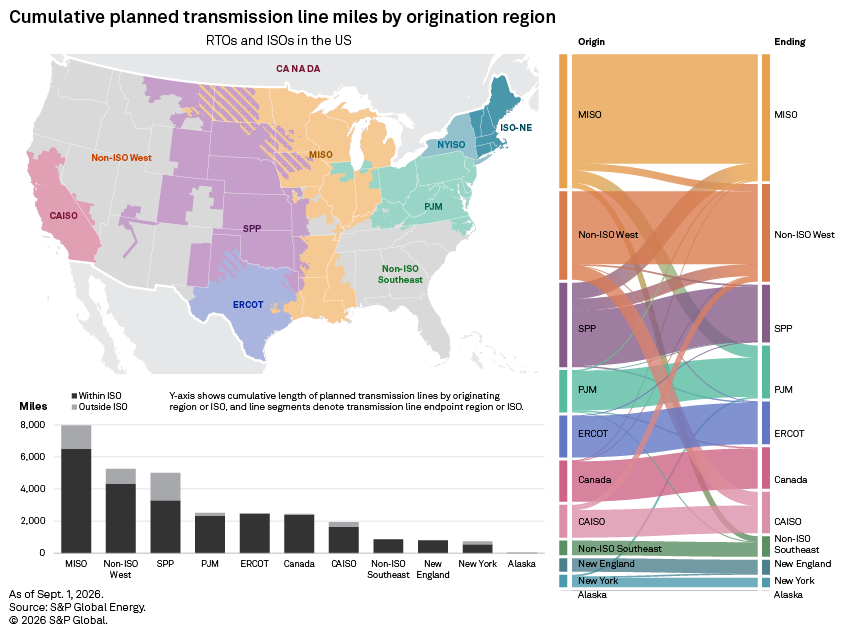
About 1,500 miles of transmission projects were added to the development pipeline across the US since September 2025, bringing the cumulative US total to 27,500 miles. Leading the way is MISO, which is undertaking one of the country's largest coordinated transmission expansions through its long-range planning process. Just under 8,000 miles of planned transmission originate in MISO. About 6,500 miles remain within MISO, while additional lines — predominantly high-voltage direct current lines — connect to PJM, the non-ISO West and the Southeast.
SPP's transmission pipeline includes new regional lines, upgrades within the footprint and stronger ties to neighboring systems. Approximately 5,000 miles of planned lines originate in the SPP region, including about 3,300 miles within SPP and roughly 950 miles extending toward MISO, as part of a $1.7 billion investment in transmission upgrades from the Joint Targeted Interconnection Queue portfolio.
ERCOT has about 2,500 miles of planned lines that originate and terminate within its footprint, along with a smaller number of proposed links to neighboring regions. Given ERCOT's relatively small geographic footprint, this represents a substantial pipeline of transmission projects. That said, there are about 200 GW of wind, solar, and battery storage in planning across Texas, along with a forecast 20 GW of data center demand, according to 451 Research. Even more noteworthy is ERCOT's interconnection queue, which is grappling with 466 GW of large loads — 90% of which come from data centers. This combination of a formidable generation pipeline and intensive load growth necessitates significant investment in transmission and distribution infrastructure.
There are roughly 2,500 miles of planned lines originating in PJM, including about 2,300 miles within the market. That total is notable but smaller than the planned mileage originating in MISO or SPP, despite PJM's much larger load and exceptionally concentrated data center pipeline.
CAISO has 1,900 miles of transmission projects in development, including about 1,600 miles within the market and more than 300 miles connecting toward the non-ISO West. Projects originating elsewhere in the West add further potential transfer capability into California.
A large majority — about 83% — of transmission lines in development are intraregional. This inward focus can limit the ability to address broad geographic mismatches between generation and load. Stronger interregional links could enable SPP and MISO to export more wind, allow California to exchange solar and evening power with neighboring states, and enable eastern markets to share capacity during weather events.
Utilities accelerate T&D investment
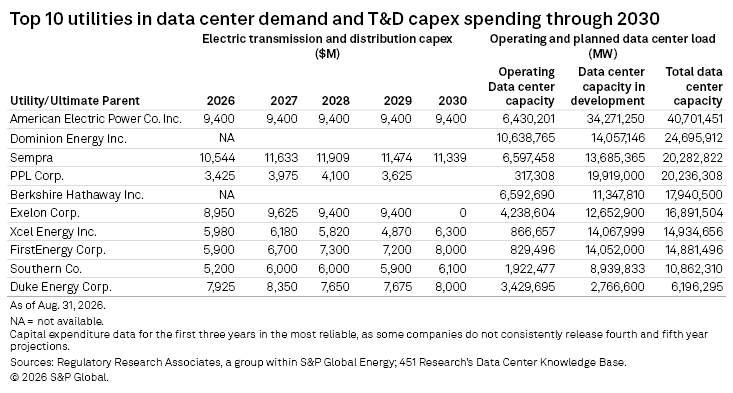
Utilities serving major data center markets are increasing capital spending on transmission and distribution (T&D) infrastructure. The top-10 table places operating and planned data center load alongside projected T&D investment, highlighting where utilities face the greatest combination of customer growth and network requirements.
The investment plans include high-voltage transmission, substations, distribution feeders, transformers, grid-hardening programs and technology intended to make better use of existing infrastructure. Companies with multiple subsidiaries covering large geographic footprints and exposure to expanding data center markets tend to rank prominently.
The 10 largest ultimate parent companies by data center load are forecast to spend $289 billion on transmission and distribution infrastructure over the next five years. This does not include Dominion Energy Inc., which, among other territories, covers the data hub of Northern Virginia, and Berkshire Hathaway Inc., whose subsidiaries include MidAmerican Energy Co., Nevada Power Co. and PacifiCorp — all of which anticipate both aggressive renewable development and data center load growth. Combined, these 10 companies have 146 GW of data center capacity planned in their territories and 140 GW of non-dispatchable renewable generation in development. Therefore, strong investment in transmission and distribution infrastructure is crucial.
Multiple strategies needed
The response to the growing grid congestion issue taking shape across utilities and grid operators includes several complementary strategies. New transmission line construction remains the most durable solution to persistent geographic constraints. High-capacity lines can move renewable power from resource areas, provide large loads, such as data centers, with access to a broader generation fleet, and improve resilience during extreme weather. The main barriers are long development timelines, permitting hurdles, particularly for lines that cross multiple jurisdictions, cost allocation, and equipment constraints.
Grid-enhancing technologies can more quickly increase the capability of existing lines. Dynamic line ratings, advanced power-flow controls and topology optimization may defer some upgrades, although they cannot substitute for new transmission where load growth exceeds the network's physical capacity.
Battery storage can reduce curtailment by charging during periods of renewable oversupply and discharging when the system is constrained. It is especially effective for intraday shifts, such as shifting California solar energy into the evening. Longer-duration constraints and seasonal imbalances still require transmission, generation or demand flexibility.
Utilities and grid operators are also seeking better large-load forecasts and stronger financial commitments from data center developers. Requiring deposits, construction milestones and minimum payments can help prevent speculative projects from obscuring the realistic outlook for grid strain.
Flexible data center operations offer another potential tool. Some computing workloads can be shifted across hours or locations, and batteries and on-site generation can reduce demand during peak hours or grid emergencies. The technical potential is significant, but grid planners generally cannot assume flexibility unless it is enforceable through contracts, tariffs, or market participation. And there is the additional complication that many data center segments cannot accommodate flexible power supply.
Colocation with generation can shorten the electrical distance between supply and demand, but it raises questions about transmission access, reliability obligations and whether existing power plants can serve private loads without shifting costs to other customers. These issues are becoming central to federal and regional large-load proceedings.
In SPP, ERCOT, CAISO, and parts of MISO, the dominant signal remains high levels of renewable curtailment, caused by non-dispatchable generation outpacing transmission expansion and flexible demand. In PJM, congestion costs and load growth increasingly reflect the disconnect between concentrated demand from data centers and other large customers and the locations of the cheapest power supply.
While the growth of data centers may help reduce curtailment if they are located near stranded renewable resources and operated with sufficient flexibility, it can also complicate the overall grid congestion issue by introducing large loads in concentrated areas at a rapid pace. Which outcome prevails will depend on siting decisions, interconnection processes, and the speed at which utilities can expand the grid.
For now, the data points to a widening infrastructure gap. Reported curtailment has more than doubled since 2020; day-ahead congestion costs in six markets increased by roughly one-third in 2025; and electricity demand continues to rise. Planned transmission and record utility investment could eventually narrow that gap, but the accelerating scale of AI development is making the target harder to reach.
Data visualizations by Leigh Lunas, Oscar Solano and Jonathan Paul Lalgee.
For wholesale prices and supply and demand projections, see the S&P Global Market Intelligence Power Forecast.
Regulatory Research Associates is a group within S&P Global Energy.
S&P Global Energy produces content for distribution on S&P Capital IQ Pro.
This article was published by S&P Global Market Intelligence and not by S&P Global Ratings, which is a separately managed division of S&P Global.