ECONOMICS COMMENTARY — 16 Sep, 2026
Global goods export growth hits joint-highest since mid-2021

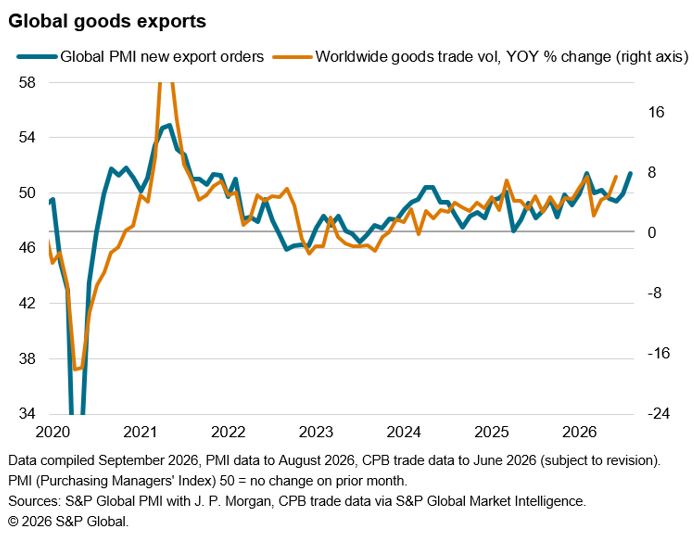
Global goods trade picked up momentum in August, with new export orders rising worldwide at one of the fastest rates seen for almost five years, according to the Purchasing Managers’ Index™ (PMI®) surveys. Growth was led by Taiwan and Japan, with especially strong gains also seen in Germany, the Netherlands and South Korea.
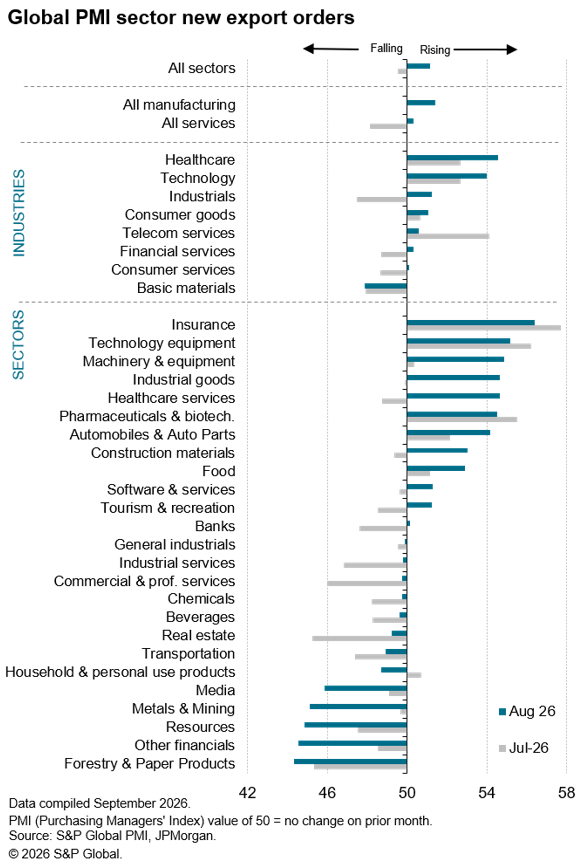
The expansion was fueled by particularly buoyant global demand for tech equipment and the broader machinery & equipment sectors, linked partly to rising AI and defense spending, though stock building due to concerns over supply and price impacts from the war in the Middle East was also again widely reported as having supported trade growth.
Global merchandise export growth accelerates
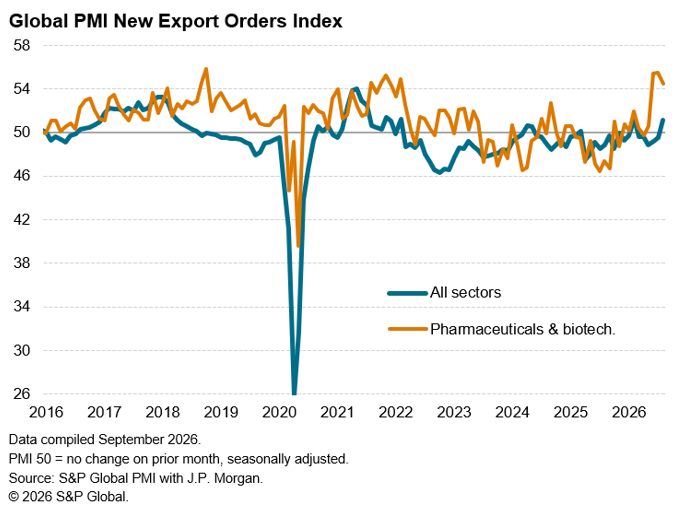
The seasonally adjusted Global Manufacturing PMI New Export Orders Index, sponsored by J.P. Morgan and compiled by S&P Global, registered 51.4 in August up from 50.0 in July. The rise takes the index back to the level seen in February, just prior to the outbreak of war in the Middle East, which had in turn been the joint-highest since July 2021.
At current levels, the PMI is broadly indicative of global merchandise trade expanding at an approximate 8% annual rate. So far, despite trade and shipping disruptions caused by the war, 2026 has seen the best performance of the manufacturing PMIs’ global export index for five years.
Taiwan leads global export upturn
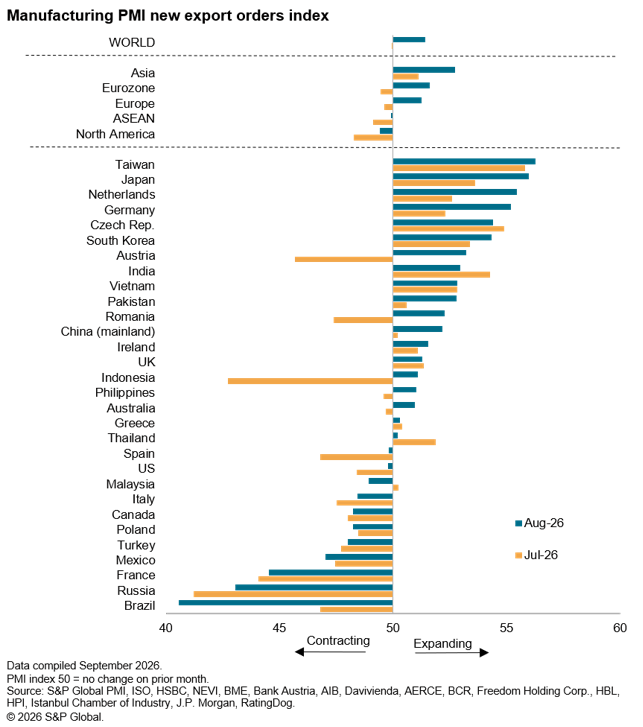
Taiwan reported the fastest manufacturing export growth of all economies survey by S&P Global for a third successive month in August, with recent months having seen its strongest gains for five years.
Exceptionally strong growth was also reported from Japan, where exports rose in August at the sharpest rate since January 2018, aided by a weakened yen.
Improving export trends in the Netherlands and Germany, at third and fourth place respectively in the global rankings in August, meanwhile helped pull eurozone export growth to its highest since early 2022.
At fifth place was South Korea, where the latest rise in exports was the largest since November 2020. Exports from mainland China also picked up rising at the sharpest rate since February.
At the other end of the scale, Brazil reported the steepest export trade decline as orders slumped at a pace not seen since the start of 2023. Notably steep falls were also seen in Russia and France.
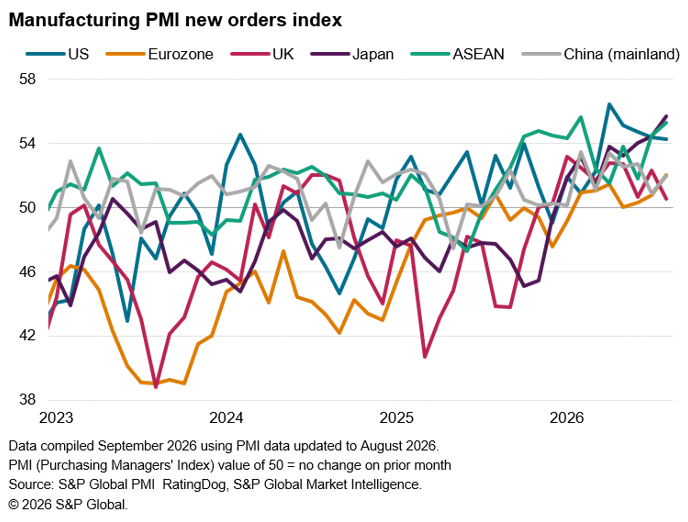
North America was meanwhile again the worst performing region of the world, reflecting broad based declines in the US, Canada and Mexico. However, the rate of loss of US goods exports eased to its weakest since exports began falling in July of last year.
Rising equipment exports
According to PMI survey contributors, this encouragingly robust overall export performance in recent months has been driven by a combination of reduced US tariff concerns and buffer stock building because of concerns over supply bottlenecks and price rises stemming from the war in the Middle East. That said, recent months also saw a noticeable increase in shipments of tech equipment and other machinery. Growth in these two sectors in part reflected exports of rising AI-related infrastructure spending and rising defense-related spending respectively.
Over the past two months, worldwide exports of tech equipment have grown at the fastest rate for almost five years, despite losing a little momentum in August compared to July’s recent high. Machinery and equipment exports meanwhile surged in August to register the largest increase for just over five years.
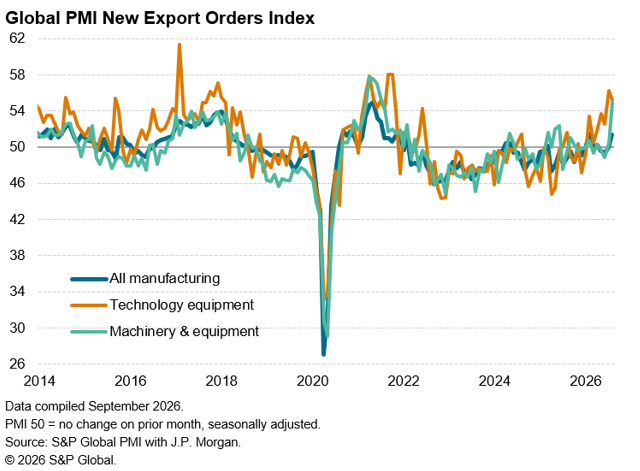
Hence, while the strongest increase in worldwide trade was again in insurance services during August, the second-strongest gain was reported for technology equipment followed by the machinery & equipment sector.
Precautionary stock building
Ongoing stockpiling meanwhile helped the pharmaceuticals and healthcare sectors remain high up the export rankings, which pharma and biotech having enjoyed some of the best gains in the PMI survey’s history in recent months. Strong gains were also notably reported for autos & parts, construction materials and food manufacturing.
© 2026, S&P Global. All rights reserved. Reproduction in whole or in part without permission is prohibited.
Purchasing Managers' Index™ (PMI®) data are compiled by S&P Global for more than 40 economies worldwide. The monthly data are derived from surveys of senior executives at private sector companies, and are available only via subscription. The PMI dataset features a headline number, which indicates the overall health of an economy, and sub-indices, which provide insights into other key economic drivers such as GDP, inflation, exports, capacity utilization, employment and inventories. The PMI data are used by financial and corporate professionals to better understand where economies and markets are headed, and to uncover opportunities.
Read our latest PMI commentary here.
This article was published by S&P Global Market Intelligence and not by S&P Global Ratings, which is a separately managed division of S&P Global.
Theme
Location
Products & Offerings