Research — SEPTEMBER 25, 2026
Beyond revenue growth: Unpacking the drivers of consumer products growth
Visible Alpha consensus estimates for CY2026 show a wide dispersion in expected growth across the household and personal products peer group, with revenue forecasts ranging from a 1.6% year-on-year decline at French household product company BIC to 6.8% growth at personal products specialist L’Oréal. But the headline figures obscure an important distinction: what is driving that growth; volume, pricing, portfolio changes or a combination of the three?
That distinction is increasingly important as consumer companies contend with uneven demand, tariff pressures and persistent cost inflation while trying to protect volumes.
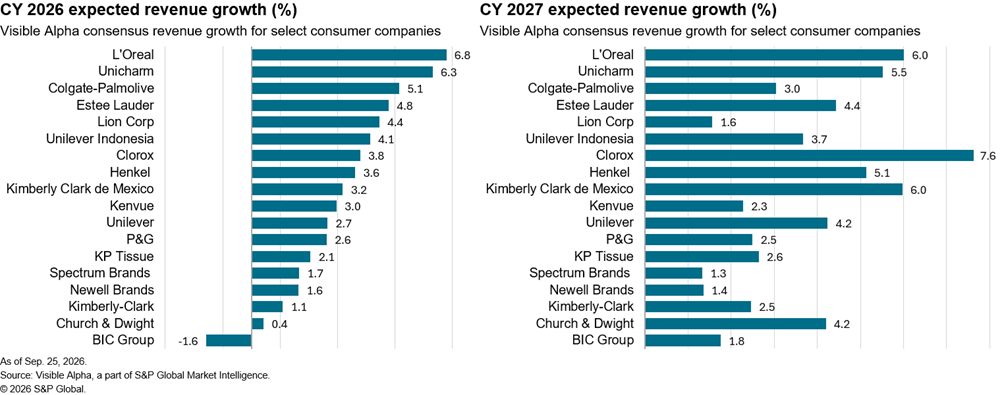
Across the Visible Alpha peer set, personal-products companies occupy much of the upper end of the expected growth range in CY 2026. L'Oréal (EPA: OR) leads with expected revenue growth of 6.8% in 2026, followed by Japan’s Unicharm (TYO: 8113) at 6.2%, and Colgate-Palmolive (NYSE: CL) at 5.1%. Growth, however, is expected to moderate for most of these companies in 2027. The exception is Estée Lauder (NYSE: EL), where growth is forecast to remain relatively resilient, easing from 4.8% in 2026 to 4.4% in 2027.
Among household-product companies, the outlook is more mixed. Church & Dwight (NYSE: CHD) has the weakest headline growth forecast in 2026 at just 0.4%, although this is expected to rebound to 4.2% in 2027. Clorox (NYSE: CLX) shows the sharpest improvement, with revenue growth accelerating from 3.8% in 2026 to 7.6% in 2027, while Henkel (ETR: HEN3) and Kimberly-Clark de México (BMV: KIMBERA) are also expected to see a meaningful acceleration. At the other end, BIC Group is the only peer expected to report a revenue decline in 2026, at -1.6%, before returning to 1.8% growth in 2027.
Similar revenue growth, very different engines
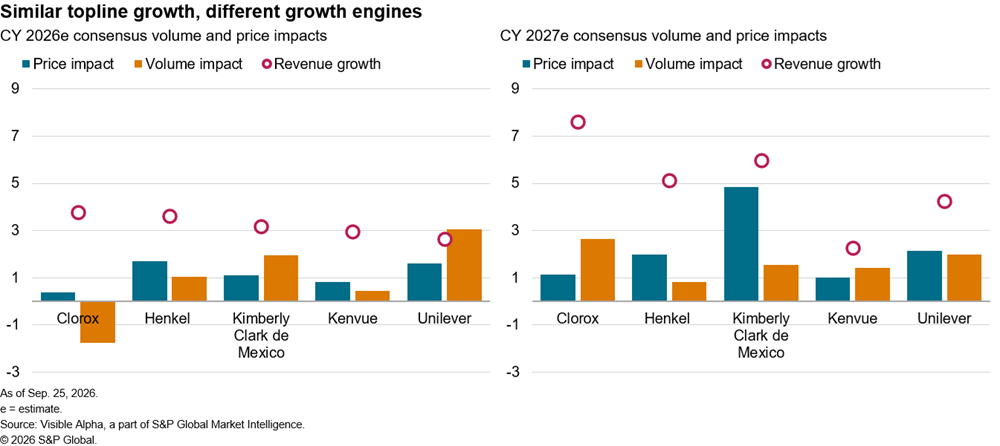
In 2026, Unilever (LSE: ULVR), Kenvue (NYSE: KVUE), Kimberly-Clark de México, Henkel and Clorox are clustered within a relatively narrow range of 2% to 4% expected revenue growth. But Visible Alpha consensus points to a much wider dispersion in 2027, with growth ranging from 2.3% for Kenvue to 7.6% for Clorox.
The differences are not confined to the ends of the range. Consensus points to markedly different contributions from volume, pricing and portfolio effects.
In 2026, Unilever is expected to have the strongest volume-led profile in this group, while Kimberly-Clark de México also stands out for the estimated volume contribution. In 2027, however, Kimberly-Clark de México is expected to become more price-driven.
For Henkel, pricing is expected to remain the larger contributor to growth in both 2026 and 2027.
Clorox is the biggest swing factor. Its 3.8% 2026 growth forecast includes a 1.7% volume decline and only 0.4% pricing impact, but consensus expects volume to rebound 2.7% in 2027, helping drive 7.6% revenue growth. Kenvue moves in the opposite direction, with growth slowing from 3% to 2.3% in 2027.
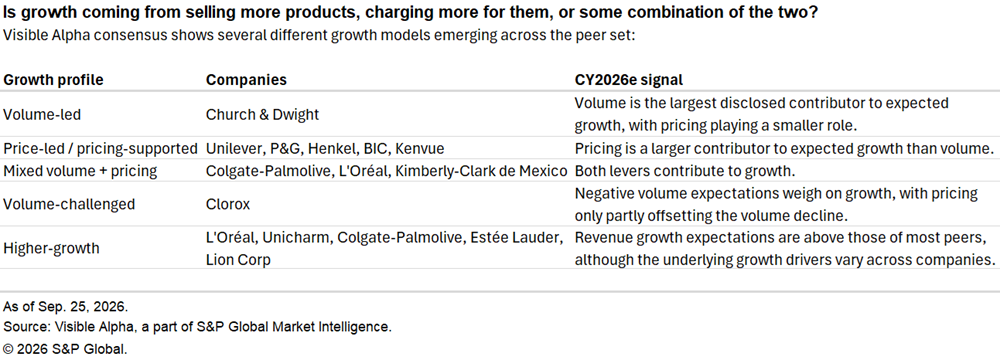
Looking beyond headline revenue growth, Visible Alpha consensus helps distinguish whether expected growth is being driven primarily by volume, pricing or a combination of the two. Analyst expectations for 2026 reveal several distinct growth profiles across the household and personal products peer group, highlighting how similar revenue growth rates can reflect very different underlying drivers.
Revenue growth is only half the earnings story
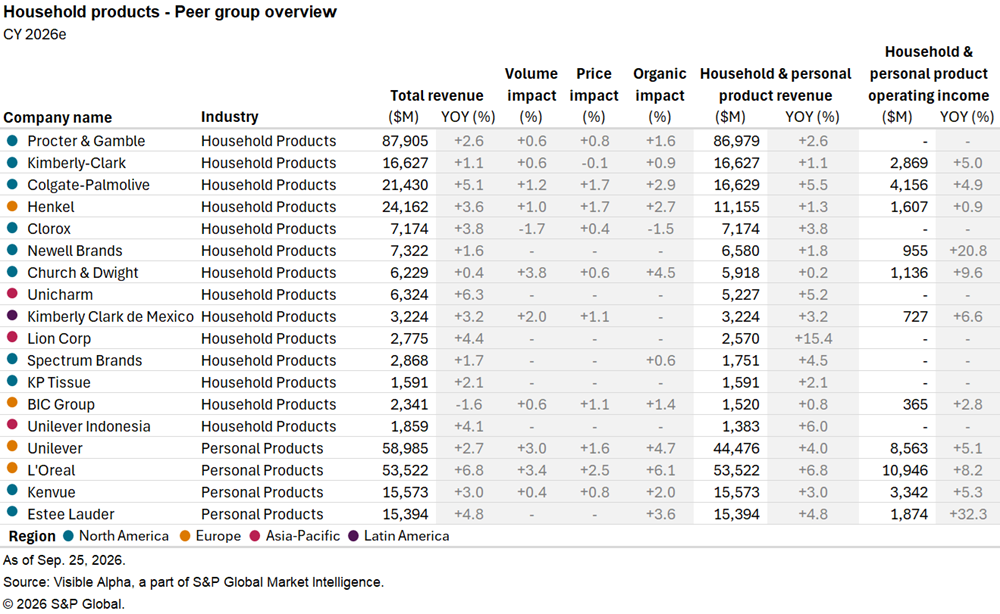
The final layer of the analysis is profitability. Comparing expected growth in household and personal products revenue with operating income reveals a wide dispersion in the amount of operating leverage embedded in consensus estimates.
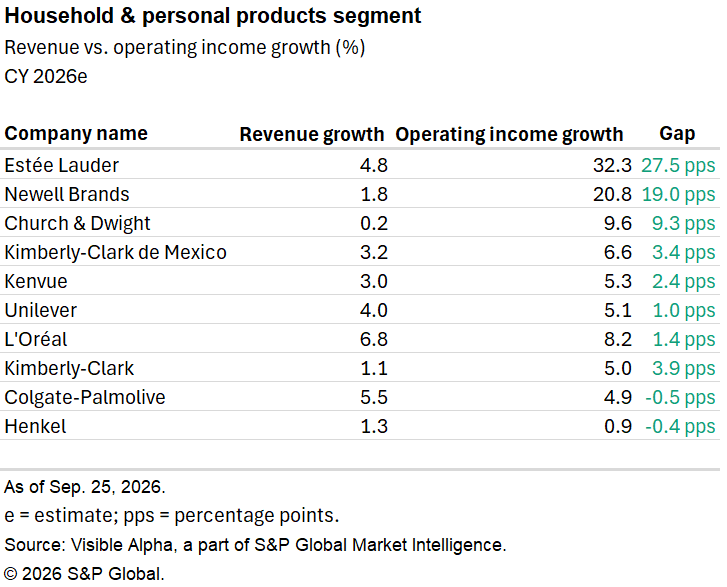
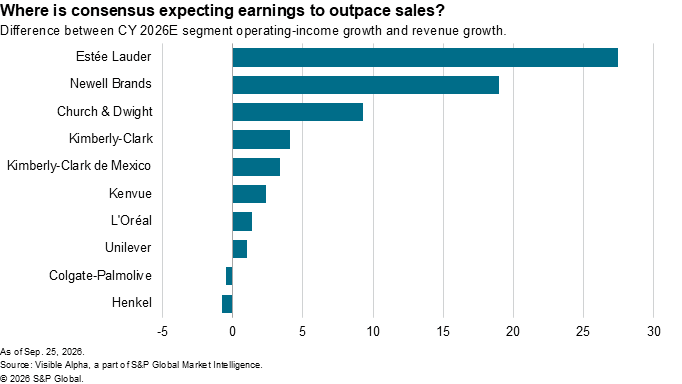
Estée Lauder stands out most clearly. Visible Alpha expects operating income for the household & personal products segment to rise 32.3% year-on-year in 2026 against revenue growth of 4.8%, a 27.5 percentage-point gap. That is consistent with the company’s ongoing Profit Recovery and Growth Plan (PRGP) turnaround strategy launched to rebuild operating margins, slash structural costs, and pivot toward agile, consumer-facing digital growth. Newell Brands (NASDAQ: NWL) and Church & Dwight also show substantial operating leverage.
The opposite pattern appears at Colgate-Palmolive and Henkel, where operating income is expected to grow slightly more slowly than revenue, by 0.5 and 0.8 percentage points respectively.
Outlook: Organic growth is expected to strengthen across much of the group
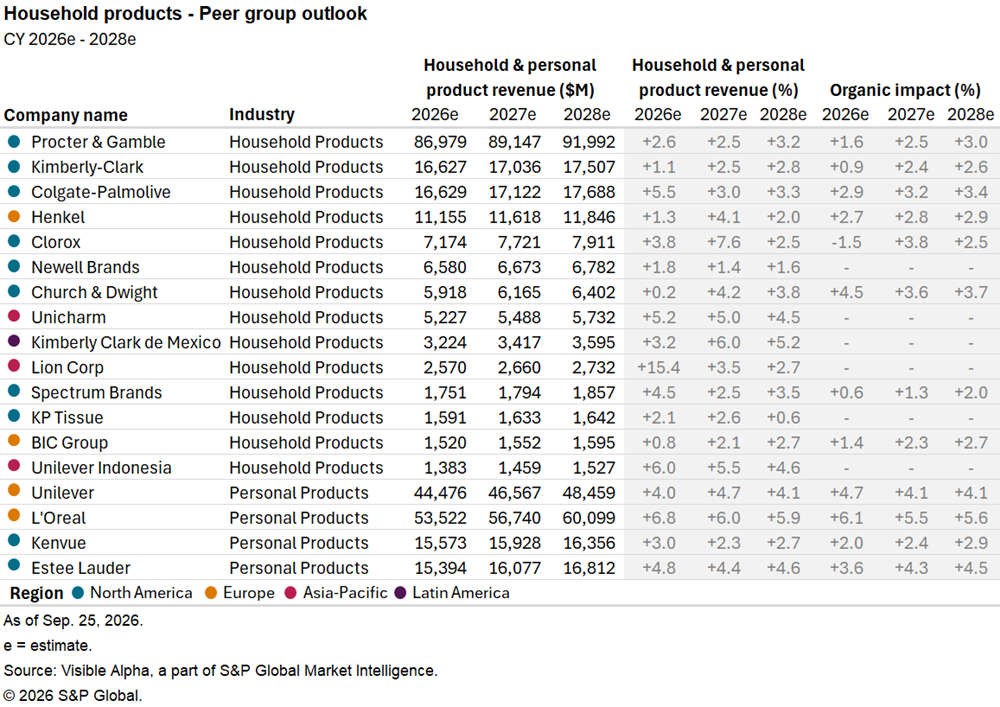
Visible Alpha consensus points to a broad improvement in underlying growth through 2028, although the trajectory differs materially across the peer group.
Procter & Gamble, Kimberly-Clark (NASDAQ: KMB) and Colgate-Palmolive are expected to see organic growth strengthen from 2026 to 2028. Church & Dwight is also expected to maintain organic growth above 3.5% throughout the period, while Estée Lauder is expected to build from 3.6% in 2026 to 4.5% in 2028. L’Oréal remains one of the fastest-growing companies in the group.
The picture is more uneven elsewhere. Clorox’s organic growth is expected to rebound sharply from -1.5% in 2026 to 3.8% in 2027, while Henkel’s product revenue growth is forecast to jump to 4.1% in 2027. Overall, the estimates point to a gradual shift towards more organic-driven growth, but with significant differences in both the pace and durability of that expansion across the peer group.
This article was published by Visible Alpha, part of S&P Global Market Intelligence and not by S&P Global Ratings, which is a separately managed division of S&P Global.
Content Type
Products & Offerings
Segment
