Research — Aug 01, 2026
Insurers went bargain hunting for BDC bonds in Q1

By Thomas Mason
Insurance companies did not shy away from the securities of business development companies in the first quarter of 2026, despite broader market concerns over the quality of some BDC portfolio investments. The industry added $1.15 billion of net exposure, according to our calculations, with the majority (76.1%) concentrated in corporate bonds.
The first quarter offered attractive bond-buying opportunities, as prices dipped before recovering in the second quarter. Only 32.2% of the bond acquisition trades made by insurance companies in the first quarter had lower prices at the end of the second quarter than on their acquisition dates (see Methodology section below for information on how we performed this analysis).
For bond buyers holding to maturity, the first quarter offered a chance to lock in higher yields. Of the buy trades made by insurance companies, 94.6% were at a higher yield-to-maturity on the trade date than at year-end. Massachusetts Mutual Life Insurance Co. took advantage of a particularly large increase in the yield of Blue Owl Technology Finance Corp. II. The life insurer reported buying $36.9 million of the BDC's notes on March 16, 2026, at a yield-to-maturity of 7.5%, up from 5.9% on Dec. 31, 2025.
Meanwhile, the market has not been kind to the common stock of Blue Owl Technology Finance Corp. II's parent company, Blue Owl Technology Finance Corp., with shares losing 14.8% in the first quarter and another 16.5% in the second quarter. Headline risk includes the potential threat of AI to software companies, the quality of private credit investments and a slew of investor redemptions. The insurance industry as a whole increased its exposure to BDC common stock in the first quarter, but to a far lesser extent than bonds: Common stock accounted for only 9.6% of net additions. The common stock acquisitions that insurers made in the first quarter have not fared well in the second quarter, with roughly two-thirds of trades underwater as of June 30.

Insurers showed an appetite for BDC securities in the first quarter, but mostly bonds. The insurance industry added $1.15 billion in net BDC exposure during the quarter, with 76.1% of that increase in corporate bonds. For those willing to accept the risk, there were ample opportunities to capture higher yields. Nearly 95% of insurers’ BDC bond purchases were made at yields above year-end levels, and many purchases benefited from the first-quarter price dip followed by a second-quarter recovery.
MassMutual was the largest net acquirer of BDC exposure, while Athene moved against the industry trend by reducing its net BDC holdings.
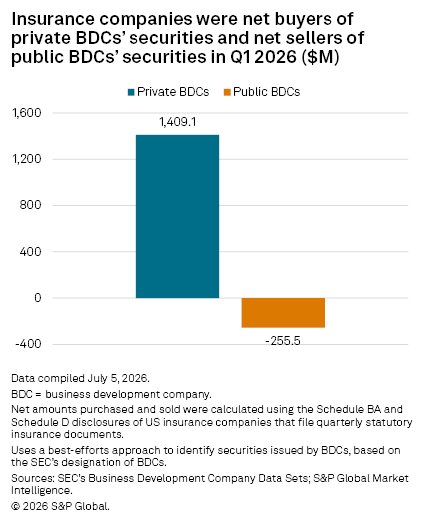
Insurers added modestly to BDC common stock, which made up only 9.6% of net additions, and bought both publicly traded and private BDC stock. The insurance industry showed a clear preference for private BDCs when it came to bond buying, however.

Top buyers and sellers
The MassMutual group of companies was the largest net acquirer of BDC exposure among US insurance underwriters in the first quarter, according to our analysis. In addition to the Blue Owl investment, MassMutual bought a variety of other BDC securities. MassMutual's top BDC buys in the first quarter were of Barings Private Credit Corp., adding $124.1 million of securities. The BDC is externally managed by Barings LLC, a subsidiary of MassMutual, and acquired its initial investment portfolio from the insurer and affiliate C.M. Life Insurance Co. in 2021.
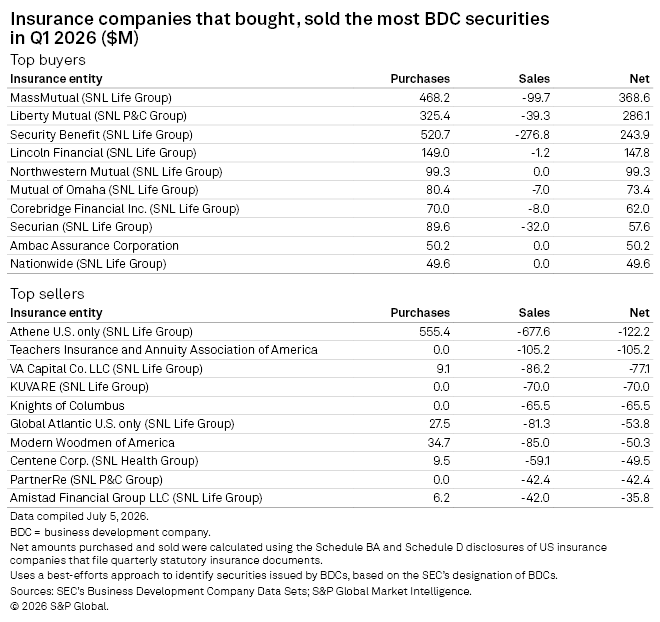
MassMutual ranked second among US insurance groups in BDC securities holdings at the end of the first quarter, with $2.82 billion in estimated fair value, which represents the sum of year-end 2025 carrying value and the net cost of purchases and divestitures during the first quarter. But those holdings were small in relation to its overall investment portfolio, accounting for only 0.8% of its net admitted cash and invested assets. The largest holder was the Athene Holding Ltd. group of US life insurance companies, which had $7.06 billion of BDC securities as of March 31, representing 2.39% of its net admitted cash and invested assets.
Notably, Athene — a subsidiary of private equity firm Apollo Global Management Inc. — went in the opposite direction of the overall industry, reducing its net exposure to BDC securities in the first quarter. It reduced its net exposure to Blue Owl Credit Income Corp. and eight other BDCs, while increasing it to six others. It bears noting that decreases are not always sales, as the bonds might have matured or been redeemed by the issuer. Disposals of Blue Owl Credit Income senior unsecured notes by Athene's primary US life company occurred on or before Feb. 19.
For context, the combined carrying value of BDC security holdings across all the insurance industries for which we have data (P&C, life, health and fraternal) was $32.90 billion as of Dec. 31, 2025, and the fair value was $33.85 billion. It is also important to note that the quarterly data reflects statutory restrictions on the dissemination of data for interim periods affecting the primary life subsidiary of Prudential Financial Inc., as well as select other smaller entities. That said, the Prudential group of companies was a relatively modest holder of BDC securities in relation to Athene and MassMutual; the fair value of Prudential's holdings was $189.4 million as of Dec. 31, 2025.
Top BDCs bought and sold
Despite all the press around them, Blue Owl BDCs were not among the top 10 net issuer buys or sales in the first quarter. Blue Owl Credit Income Corp. and Blue Owl Technology Finance Corp. were the ninth- and tenth-highest based on acquisitions alone, but disposals knocked them down to net acquisitions of only $41.2 million and $62.9 million, respectively.
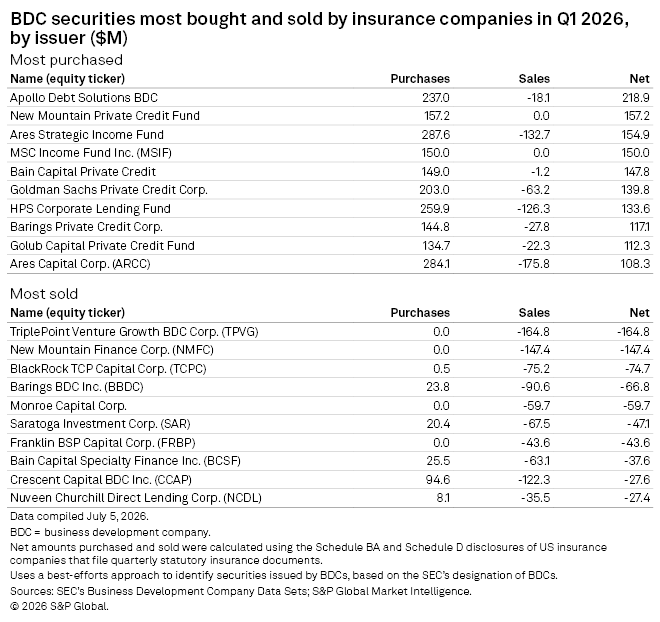
As the top purchases and sales charts show, insurers tended to favor the securities of nonpublic BDCs in the first quarter. The insurance industry acquired common stock of both public and private BDCs in the first quarter but favored the former, adding $74.4 million in net exposure to publicly traded BDCs, versus $36.7 million for nonpublic. A much different picture emerged in the bond market, however. Insurers added $1.37 billion in exposure to private BDC debt, while decreasing exposure to public BDC debt by $352.1 million.
Methodology
This analysis used a combination of S&P Global Market Intelligence data feeds: SNL Insurance Regulatory Data, Business Entity Cross Reference Service, Market Data and Fixed Income Pricing. We started with the SEC's Business Development Company Data Sets and extracted the central index keys of the BDCs. We entered the CIKs into the Cross Reference Service data feed, which returned a list of all the CUSIPs issued by those companies, and then fed that CUSIP list into the Insurance Regulatory Data data feed to retrieve all the transactions insurance companies made in the first quarter involving those CUSIPs.
We calculated price changes using the dates the insurance companies reported buying the securities, as well as the Market Data and Fixed Income Pricing data feeds from S&P Global Market Intelligence. For equities, we used daily closing prices, and for fixed income, we used bid data as of 4 p.m. ET on each date, since the bid price would be the price the insurer could fetch in the market, and 4 p.m. would be the day's closing price. Calculating insurers' bond trade performance is not a perfect science, as some companies do not report the exact dates of their trades. Prices are also not available for all securities, as some are not traded.
We automated these processes using a series of Python scripts with embedded SQL queries. To get the data, we used a Snowflake connector in Python, but the data feeds can also be accessed in other ways, such as through a Workbench notebook.

Access S&P Global's Workbench platform on Databricks.
This article was published by S&P Global Market Intelligence and not by S&P Global Ratings, which is a separately managed division of S&P Global.