Research — Aug 01, 2026
Above average year-to-date resources boost outlook for US wind, solar owners

By Adam Wilson
The US renewable fleet had modestly above-normal resources in the first half of 2026, with average solar insolation 1.3% above the 20-year norm and wind speeds averaging 0.5% above normal from January through June. North of the border, Canada's solar portfolio remained below normal through the first six months, with insolation 2.2% below average across 3.9 gigawatts, while wind resources were stronger, averaging 1.9% above normal across 18.1 GW of capacity.
In the US, North Carolina's 7.3-GW solar fleet recorded the highest notable surplus among large US markets at 5.1% above the 20-year average from January through June, while Virginia's 5.3-GW portfolio was 4.0% above normal. Other notable above-average solar states included New Jersey (1.4 GW) at 4.6%, Kentucky (1.2 GW) at 4.5% and Connecticut (500 megawatts) at 4.4%. June produced especially strong solar readings in parts of New England, with Connecticut and Rhode Island posting monthly insolation deviations of 14.3% and 13.3% above normal, respectively, while Massachusetts was 13.1% above average.
Conversely, insolation across the 653 MW of operating solar capacity in Hawaii had the largest radiation deficit among US states at 6.4% below the 20-year average from January through June. Among larger US solar markets, Texas — home to the largest solar fleet at 37.9 GW — ended the six-month period slightly below normal at 0.2% under the 20-year average, while Arizona, Georgia and New York also posted minor year-to-date deficits. Canada's two main solar provinces remained below normal through the first half, with Ontario's 1.8-GW portfolio 2.6% below the 20-year average and Alberta's 2.0-GW fleet 1.9% below normal. June was particularly cloudy for several solar-heavy regions, including Texas at 7.9% below normal and Alberta at 9.8% below normal.
|
Download data details in Excel
|

Wind resources were more regionally mixed, but several central US and Canadian provinces recorded strong six-month wind speed surpluses. Wyoming led large US wind markets, with average wind speeds 7.6% above the 20-year average across 4.8 GW of capacity, followed by Montana (2.2 GW) at 6.0% above normal. Canada's two largest wind provinces — Ontario (5.5 GW) and Alberta (5.2 GW) — were 5.3% and 4.7% above the 20-year average, respectively, while British Columbia was 4.5% above normal though over a smaller wind fleet.
Below-normal wind speeds were most pronounced in Quebec and the western US. Quebec's 4.1-GW wind fleet recorded a 5.6% year-to-date deficit, with June being especially short at 16.5% below the 20-year average. In the US, Oregon, Arizona and Washington posted year-to-date wind speed deficits of 4.9%, 4.8% and 4.5%, respectively. June underscored the month-over-month volatility of wind resources, with Mississippi and Arkansas experiencing monthly wind speed deviations of 17.5% and 16.4% above normal, respectively, while New Brunswick, British Columbia, Maine and Prince Edward Island recorded June deficits of 10.0% or higher compared to the 20-year average.
Among the top 20 solar owners in the US and Canada, the largest portfolios generally tracked close to normal but still slightly above the 20-year average over the first half. NextEra Energy Inc., the largest solar owner in the dataset with 19.3 GW, recorded insolation 0.4% above normal from January through June, while RWE AG's 6.2-GW portfolio was 1.2% above average. Dominion Energy Inc. stood out among the major solar owners, with its 3.3-GW portfolio recording the strongest positive year-to-date deviation among the top 20 at 4.1% above normal.
TotalEnergies SE had the weakest year-to-date solar deviation among the top 20 at 0.4% below normal across 2.1 GW, and its June reading was 10.5% below average. On the positive side, Pine Gate Renewables LLC's 2.0-GW fleet recorded a 3.0% year-to-date solar surplus, while WEC Energy Group Inc. and Brookfield Corp. posted above-average readings of 2.1% and 2.0%, respectively.
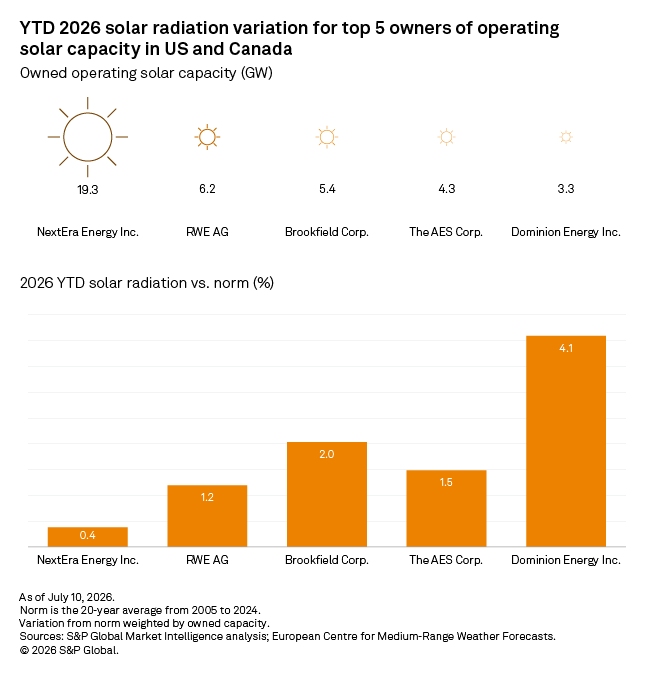
Notable radiation-deprived solar projects were AES Corp.'s Big Island Waikoloa Solar Project and the Hale Kuawehi Solar Project, both located in Hawaii. Each project recorded year-to-date insolation 9.0% below normal. The highest radiation surpluses at the project level were largely confined to small projects, with the 10-MW Agate Bay Solar Project (OR Solar 2) in Oregon being the largest project with a positive deviation above 7.0%.
Wind portfolio results among the top 20 owners were more dispersed than solar, with the largest owners generally close to normal but several mid-sized portfolios showing more pronounced deviations. NextEra Energy led in wind ownership with 21.2 GW and recorded average wind speeds 0.4% above the 20-year norm from January through June. Berkshire Hathaway Inc., the second-largest wind owner at 12.3 GW, posted a 0.7% year-to-date surplus and third-place Iberdrola SA's 8.8-GW portfolio was 1.0% below normal.
The strongest wind owner results came from American Electric Power Co. Inc. and TransAlta Corp. whose portfolios both recorded year-to-date wind speed deviations of 3.9% above normal. EDP SA and LS Power Development LLC also had solid wind resource boosts, with year-to-date deviations of 2.9% and 2.6% above the 20-year average. Xcel Energy Inc. had the largest negative year-to-date deviation among the top 20 wind owners at 1.5% below normal, followed by Canada Pension Plan Investment Board at 1.3% below normal. June winds were broadly supportive for the largest owners, with NextEra Energy, Berkshire Hathaway and Iberdrola recording monthly wind speed surpluses of 7.7%, 4.5% and 5.7%, respectively.
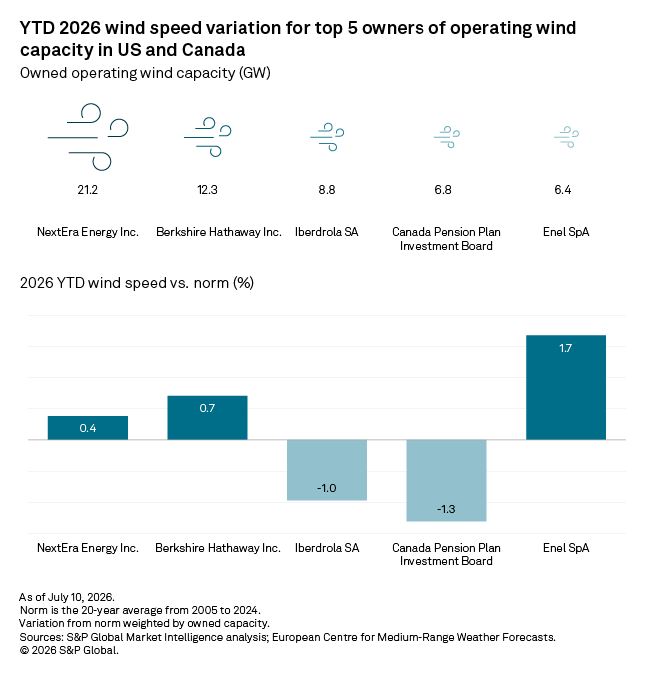
At the project level, Invenergy LLC's 135-MW Judith Gap Wind project in Montana led wind projects with a year-to-date wind speed deviation of 12.3% above normal and a June deviation of 17.1% above average. South Peak Wind Farm in Montana, owned by BlackRock Inc. and Canada Pension Plan Investment, was close behind at 12.2% above normal year-to-date. On the negative side, Strauss Wind Energy Project (Lompoc Wind) in California recorded a 12.8% year-to-date wind speed deficit, while Seigneurie de Beaupre Wind Farm 4 in Quebec was 9.5% below normal and 24.1% below average in June.
Solar radiation is the mean surface downward shortwave radiation flux, measured from the fifth-generation European Centre for Medium-Range Weather Forecasts reanalysis. This variable includes direct and diffuse solar radiation and is the model equivalent of global horizontal irradiance — the value measured by a pyranometer, a solar radiation measuring instrument. Wind speed is the value 100 meters above the ground from the same dataset. The data is available at quarter-degree latitudes and longitudes, with a spacing of slightly over 27.5 km. This analysis compares the June 2026 values with the 20-year average (2005–2024) for June, as well as the 20-year average for January through June.
Data visualizations by Jonathan Paul Lalgee and Oscar eduardo Solano.
For wholesale prices and supply and demand projections, see the S&P Global Market Indicative Power Forecast.
Regulatory Research Associates is a group within S&P Global Energy.
S&P Global Energy produces content for distribution on S&P Capital IQ Pro.
Kristin Larson contributed to this article.
This article was published by S&P Global Market Intelligence and not by S&P Global Ratings, which is a separately managed division of S&P Global.