Featured Topics
Featured Products
Events
S&P Global Offerings
Featured Topics
Featured Products
Events
S&P Global Offerings
Featured Topics
Featured Products
Events
S&P Global Offerings
Featured Topics
Featured Products
Events
Language
Featured Products
Ratings & Benchmarks
By Topic
Market Insights
About S&P Global
Corporate Responsibility
Culture & Engagement
Featured Products
Ratings & Benchmarks
By Topic
Market Insights
About S&P Global
Corporate Responsibility
Culture & Engagement
S&P Dow Jones Indices — 17 Mar, 2020
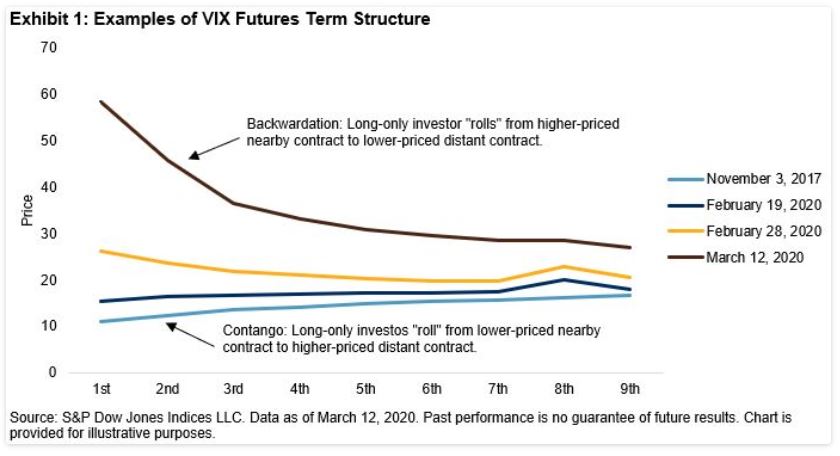
Backwardation is incredibly uncommon in the VIX® futures curve. While the reason behind this term structure is not perfectly understood, the conclusion is clear: long and hold does not work for VIX futures, as the roll cost burns.
There are different ways to measure VIX futures backwardation: by using the relationship between the VIX level and the front-month futures, between the first and second month futures, or between points further out on the curve.
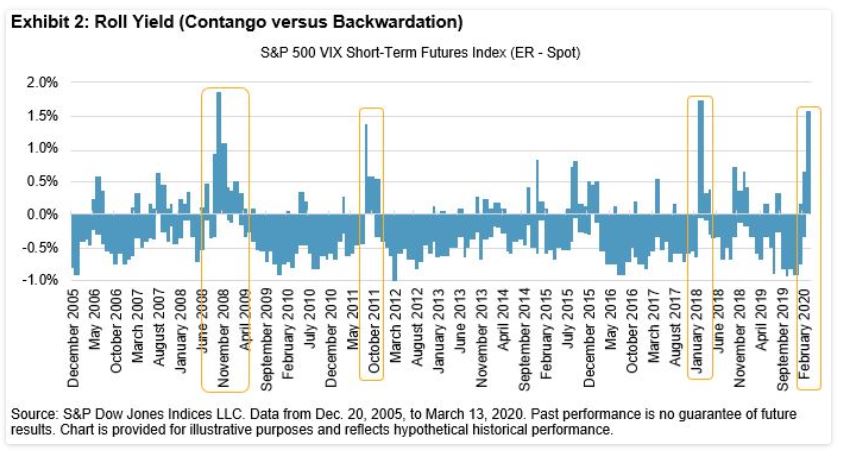
One way I think highly insightful is to calculate the roll yield by taking the return of the S&P 500® VIX Short-Term Futures ER MCAP Index (ER measures the price return plus the roll return) less the returns of the S&P 500 VIX Short-Term Futures Index (which measures the price return only). Backwardation was implied by a positive result, whereas contango was implied by a negative result. This approach also allows us to decompose the return of the S&P 500 VIX Short-Term Futures ER MCAP Index into the price change of VIX futures (at constant one-month maturity) and roll yield/cost.
Backwardation is incredibly uncommon in the VIX futures curve. Since 2005, there have only been four periods where the roll yield was wider than 1%—during the financial crisis, when the U.S. lost its ‘AAA’ credit rating in 2011, in February 2018, and now.
The implication of this is that when VIX futures are backwardated, exchange-traded products that track the S&P 500 VIX Short-Term Futures ER MCAP Index may earn a positive return from rolling into a cheaper contract before expiry, independently from the futures price change. Thus if the VIX level is unchanged, the index can still provide positive returns through the roll yield. For example, this roll yield averaged 1.2% per day last week (March 9-13, 2020).
We know backwardation is an uncommon occurrence, and Exhibit 3 provides some historical context of how long backwardation has lasted in prior periods.
Note the longest streaks in Exhibit 3 were 76 and 63 days and they occurred in 2011 and 2008, respectively. During both periods, roll yield contributed 115% and 45% to the S&P 500 VIX Short-Term Futures ER MCAP Index, respectively.
We have been in backwardation for three weeks (as of March 13, 2020), and VIX is approaching an all-time high; if the markets continue to be volatile, we could be in this situation for some time.


