


S&P Dow Jones Indices — 25 Jul, 2020
The S&P Systematic Global Macro Index – Catching the Trend

By Rupert Watts
Trend-following strategies have the potential to outperform during periods of crisis, and that is exactly what the S&P Systematic Global Macro Index (S&P SGMI) did during the COVID-19-related drawdowns. Here we will examine this index and attribute its performance YTD.
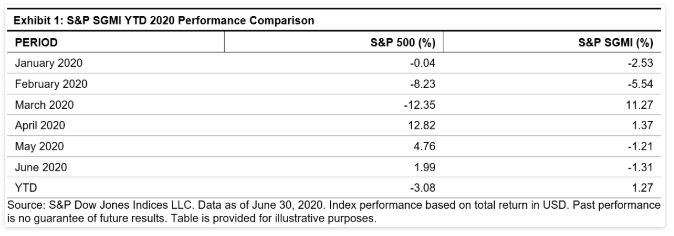
The S&P SGMI is a trend-following strategy that takes long or short positions in 37 constituent futures across the following sectors: equites, commodities, fixed income, and FX. As Exhibit 1 shows, the index has returned 1.3% so far in 2020, and it performed particularly well during the height of the market volatility, finishing March 2020 up 11.3%.
The strong performance of the S&P SGMI in March 2020 was directly a function of the severe market conditions that prevailed across financial markets, combined with its flexible model that can adapt to the current environment. The model is designed to assess each constituent future individually to identify the most current, statistically relevant trend.
Importantly, the length of each constituent’s trend is dynamic, and only the most recent period of time when the trend was stable is used. This is determined using an iterative process that starts with the most recent 22-day period and adds five-day increments until the longest stable trend is identified using a statistical test.
Constituents are then risk-balanced to ensure no single sector or constituent drives the volatility of the index.
Attribution Analysis
In the first quarter of 2020, the S&P SGMI trend-following algorithm identified several moves, predominantly in commodities, where downward momentum in energy markets had gathered pace.
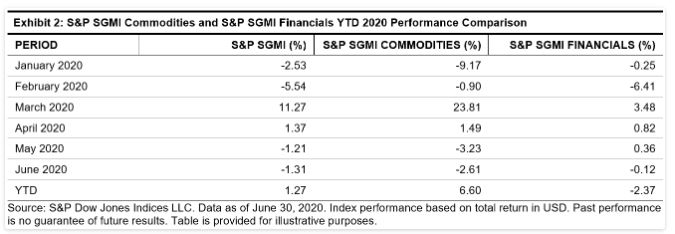
To highlight the role that commodities played, Exhibit 2 shows the performance of two standalone sub-indices computed using the same methodology as the S&P SGMI. The first is the S&P Systematic Global Macro Commodities Index (SGMI Commodities; the physical commodity futures component), and the second is the S&P Systematic Global Macro Financials Index (S&P SGMI Financials; the equity, fixed income, and FX components). Clearly, it was the S&P SGMI Commodities that performed particularly well in March 2020, finishing the month up 23.8%.
To further attribute the YTD performance, it is necessary to examine the position direction for the underlying constituents. Exhibits 3 and 4 show the position direction for the commodity and equity constituents within the S&P SGMI. Note that new positions are implemented from the second through the sixth business day of the month.
Starting with commodities, Exhibit 3 shows the index went short WTI and Brent in February 2020 and thus benefited from the plunge in energy, with WTI contributing 1.7% and Brent contributing 1.6% in March 2020 alone. In March, the index was also short gasoil, heating oil, and gasoline, which all had substantial declines, contributing 1.1%, 1.1%, and 1.8%, respectively.
Short positions in copper, cotton, live cattle, and corn contributed to profit in March 2020 as well, though far less substantially. The S&P SGMI was negatively affected by long positions in sugar (contributing -0.8% in March 2020), while long positions in precious metals did not have a material impact on the index.
The majority of commodities remained short in the second quarter of 2020, thus eroding some of the first quarter gains as most of them rebounded.
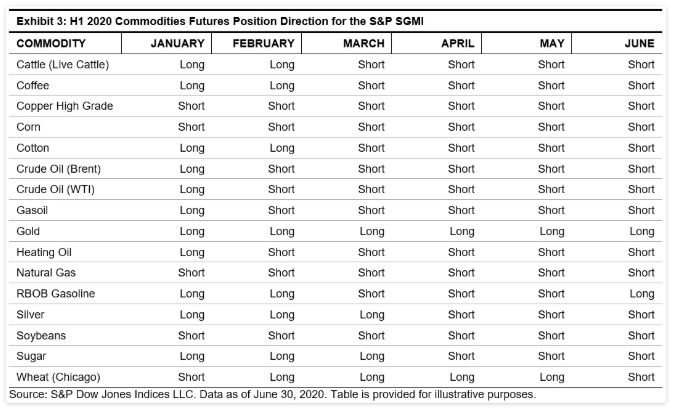
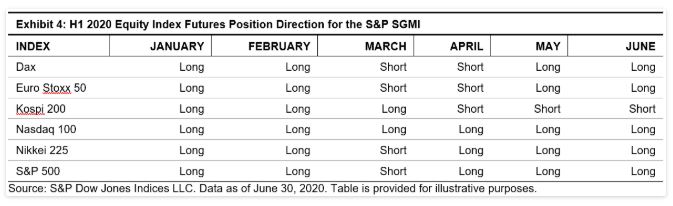
Exhibit 4 shows position directions for the equity index components. The S&P SGMI benefited from short positions taken in March 2020 in the S&P 500®, Nikkei 225, Dax, and Euro Stoxx 50, which offset losses from long positions in February 2020. The S&P 500 contributed -0.7% in February 2020 and 0.8% in March 2020 to finish the quarter positive.
Long positions in the Kospi 200 and Nasdaq 100 adversely affected performance in the first quarter; however, these latter two indices lost slightly less ground in March 2020 than the others. Overall, the equity asset class finished slightly down in the first quarter.
The S&P 500 and Nikkei 225 flipped to long in April 2020, while the Kospi 200 switched to short, meaning half the equity positions were long and half were short. The Dax and Euro Stoxx 50 went long in May 2020, leaving the Kospi 200 as the only remaining short position. Overall, the equity asset class finished slightly up for the second quarter.
The fixed income components switched from short in February 2020 to long in March 2020, and finished the quarter slightly down. They all remained long in the second quarter and did not contribute meaningful returns, as yields saw little change.
The majority of the FX positions were short in the first quarter (the British pound being the exception in March 2020), and all remained short versus the U.S. dollar in the second quarter.
Conclusion
Trend-following strategies can play an important role in client portfolios, offering the potential for diversifying returns during periods of market stress. Through its flexible model, the S&P SGMI was able to perform well through the initial stages of the COVID-19 crisis. As we enter the third quarter of 2020 with continued uncertainty around the coronavirus, it will be interesting to follow its future performance.
Content Type
Location
Language