


Blog — 12 Jul, 2021
Monthly Report on Credit Risk Trend of Chinese Listed Companies

By Jason Wang
Highlights
From early 2021 to May 2021, the risk trends of all sectors showed an initial upward movement followed by a downward movement, in line with the volatile fluctuation of stock markets around the Chinese New Year.
In May 2021, the credit risk for all sectors eased off somewhat compared to the month before. Energy, Financials and Materials posted a significant decline, while Communication Services, Information Technology and Utilities fell by a smaller amount.
Sub-industries with higher risks included Automobiles, Auto Components, Airlines, Hotels, Restaurants & Leisure and Food & Staples Retailing, while sub-industries with lower risks included Tobacco, Biotechnology, Insurance, Diversified Financial Services and Commercial Banks.
S&P Global Market Intelligence (“Market Intelligence”) will begin to report trends in Probability of Default Market Signal (PDMS) for China A-share listed companies on a monthly basis starting in June 2021. The PDMS is based on the sophisticated share price-driven model of Market Intelligence, providing a point-in-time credit assessment of A-share listed companies. It offers strong early-warning signals and timely indications of risk in the secondary market. This article demonstrates PDMS trends for GICS[1] secondary industries (referred to as “sectors”) and tertiary industries (referred to as “sub-industries”).
Chart 1: PDMS Trends of A-share Listed Companies by Sector
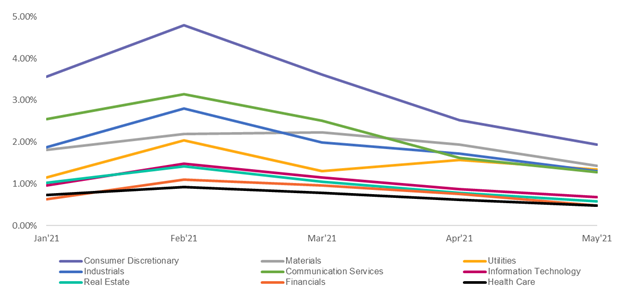
Source: Market Intelligence. PDMS is based on the share price-driven model; as of 15 June 2021. For illustrative purposes only.
As shown in Chart 1, from early 2021 to May 2021, the risk trends of all sectors showed an initial upward movement followed by a downward movement, in line with the volatile fluctuation of stock markets around the Chinese New Year. The sectors with a higher PDMS included Consumer Discretionary, Materials, Utilities, Industrials and Communication Services. Those with a lower PDMS included Real Estate, Financials and Health Care. Table 1 shows the monthly change for each sector.
Table 1: Change in PD for Each Sector between February and May 2021
|
Sectors |
No. of listed companies |
Feb 2021 (%) |
Mar 2021 (%) |
Apr 2021 (%) |
May 2021 (%) |
|
Energy |
85 |
57.60 |
-32.12 |
-5.86 |
-40.86 |
|
Financials |
110 |
75.48 |
-12.89 |
-21.67 |
-36.97 |
|
Consumer Staples |
238 |
20.25 |
9.98 |
-12.71 |
-31.25 |
|
Materials |
697 |
20.80 |
1.68 |
-12.97 |
-26.36 |
|
Real Estate |
141 |
38.43 |
-25.71 |
-25.17 |
-25.86 |
|
Industrials |
1101 |
49.27 |
-29.04 |
-13.55 |
-23.89 |
|
Consumer Discretionary |
553 |
34.37 |
-24.72 |
-30.02 |
-23.23 |
|
Health Care |
373 |
25.87 |
-15.10 |
-22.17 |
-22.69 |
|
Communication Services |
136 |
23.53 |
-20.16 |
-35.56 |
-21.26 |
|
Information Technology |
739 |
53.16 |
-22.38 |
-24.26 |
-20.97 |
|
Utilities |
107 |
77.79 |
-36.26 |
20.91 |
-14.43 |
Source: Market Intelligence. PDMS is based on the share price-driven model; as of 15 June 2021. For illustrative purposes only.
In May 2021, the credit risk for all sectors eased off somewhat compared to the month before. Energy, Financials and Materials posted a significant decline, while Communication Services, Information Technology and Utilities fell by a smaller amount. Significant changes were observed in the Energy and Utilities sectors compared to April. The Energy sector shifted from a stable state to a decline, while the Utilities sector dropped slightly after a drastic rise in April.
Chart 2: PDMS Trend of A-share Listed Companies by Sub-Industries
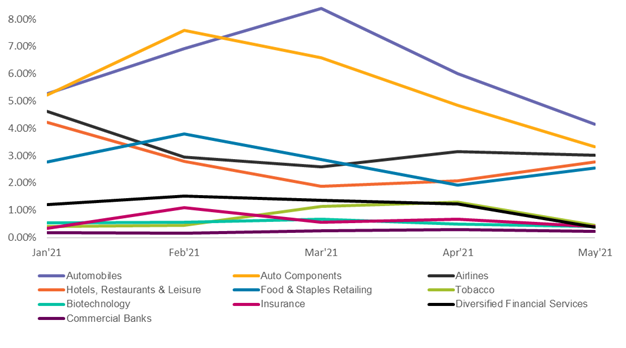
Source: Market Intelligence. PDMS is based on the share price-driven model; as of 15 June 2021. For illustrative purposes only.
Chart 2 above shows the five sub-industries with the highest and lowest PDMS in May. Sub-industries with higher risks included Automobiles, Auto Components, Airlines, Hotels, Restaurants & Leisure and Food & Staples Retailing, while sub-industries with lower risks included Tobacco, Biotechnology, Insurance, Diversified Financial Services and Commercial Banks. Among the sub-industries with higher risks, Automobile and Auto Components have been at a high level since the beginning of 2021. Sub-industries with lower risks have stayed low throughout the period. Table 2 below shows the five sub-industries with the biggest declines in risk in May and the five with the biggest increases.
Table 2: Change in PD for Each Sub-Industry between February and May
|
Sub-industries |
Number of listed companies |
February2021 (%) |
March 2021 (%) |
April 2021 (%) |
May 2021 (%) |
|
Diversified Financial Services |
4 |
27.19 |
-10.87 |
-9.60 |
-68.43 |
|
Tobacco |
1 |
11.22 |
148.03 |
15.38 |
-66.36 |
|
Aerospace & Defense |
48 |
82.43 |
17.94 |
-14.43 |
-46.60 |
|
Capital Markets |
57 |
60.11 |
-0.49 |
-9.27 |
-42.27 |
|
Health Care Technology |
6 |
-0.12 |
-8.47 |
-19.77 |
-42.26 |
|
Household Durables |
95 |
47.31 |
-9.56 |
-22.48 |
-1.04 |
|
Home Furnishings |
7 |
16.81 |
-2.98 |
1.05 |
22.62 |
|
Consumer Finance |
4 |
26.52 |
-21.45 |
-20.98 |
29.70 |
|
Food & Staples Retailing |
25 |
36.94 |
-24.73 |
-32.39 |
31.64 |
|
Hotels, Restaurants & Leisure |
35 |
-33.76 |
-32.50 |
9.88 |
33.85 |
Source: Market Intelligence. PDMS is based on the share price-driven model; as of 15 June 2021. For illustrative purposes only.
Diversified Financials, Tobacco, Aerospace & Defense, Capital Markets and Health Care Services were the five sub-industries that saw the deepest declines in risk in May. Household Durables, Home Furnishings, Consumer Finance, Food & Staples Retailing and Hotel, Restaurants & Leisure were the five sub-industries with the highest increases in risk (among which, Household Durables had the smallest change in risk, but its absolute change was negative). In particular, the last three sub-industries listed in Table 2, which all saw a decline and then a rise in risk, are worthy of continuous attention in the future.
Products & Offerings