
Guide to Construction & Engineering Industry KPIs
This guide highlights the key performance indicators for the construction & engineering industry and where investors should look to find an investment edge.
Industry Overview
The construction & engineering (C&E) industry is a crucial driver of global economic growth, infrastructure development, and urbanization. Encompassing the design, development, and construction of buildings, transportation networks, and energy facilities, it forms the backbone of essential infrastructure that underpins modern economies. The sector includes a wide range of services such as civil engineering, mechanical and electrical systems, project management, and consulting.
Spanning from public infrastructure to private sector projects, the industry is characterized by complex project management, regulatory challenges, and rapidly evolving technologies. Broadly, the construction and engineering industry is divided into two main segments: EPC (Engineering, Procurement, & Construction) and O&M (Operations & Maintenance).
The EPC segment includes:
- Engineering: Involving initial architecture, engineering concepts, and design planning.
- Procurement: Covers purchasing materials, materials management, inspection, and logistics.
- Construction: Includes employee hiring and training, subcontractor management, and supporting systems, equipment, and tools.
The O&M segment encompasses a broad range of specialized services, delivered either directly or through partnerships, such as joint ventures. Key services include:
- Operation and maintenance: Managing complex government facilities, such as military bases and test ranges.
- Engineering services: Network and communications engineering, software development, IT infrastructure design, cyber defense, and cloud computing.
- Waste management: Deactivation, decommissioning, and disposal of nuclear and hazardous waste.
- Component testing: Developing and testing new components and platforms, along with technical support for modernizing aging weapon systems.
- Logistics support: Facilitating government supply and distribution networks.
Within both the infrastructure and the industrial segments, construction & engineering companies’ clients range from local, state, and federal governments to national governments and private corporations in the power and petrochemical sectors. Key project types include:
- Highways, bridges, airports, railways, and other transit infrastructure
- Maritime and terminal facilities
- Dams, water, and wastewater treatment projects
- Industrial production facilities
- Mines and mining operations
Companies in the industry operate on a contract basis, which includes:
- Fixed-Price Contracts: Negotiated based on a specific project scope, often used in construction management and design-build services.
- Time-and-Materials Contracts: Common for smaller projects, these contracts involve negotiating hourly rates and charging clients for actual hours worked.

Key Construction & Engineering Industry Metrics
Key performance indicators (KPIs) are the most important business metrics for a particular industry. When understanding market expectations for the construction & engineering industry, whether at a company or industry level, some KPIs to consider include:
- Beginning Backlog
- Backlog Value
- Burn Rate
- Book-to-Bill Ratio
- Net Order Value
- EPC Revenue
- Operations & Maintenance Revenue

Construction & Engineering Industry Business Model
-
Expenses
-
Revenue
-
Profitability
C&E companies face a range of expenses associated with the execution of projects, maintenance of operations, and business development. The key expenses typically include:
- Cost of goods sold (COGS): COGS is a major expense for construction & engineering companies due to the nature of their business, which is heavily reliant on materials, labor, and project-specific inputs. COGS includes either the cost of goods sold or the cost of services rendered. Expenses under COGS include wages, benefits, subcontractor costs, materials, equipment, and other direct and indirect costs, including related depreciation.
- Depreciation & amortization (D&A) expenses: Expenses associated with the wear and tear of physical assets and the amortization of intangible assets.
- Selling, general, and administrative (SG&A) expenses: This includes advertising expenses, employee benefits, and other operational overheads not directly tied to project execution.
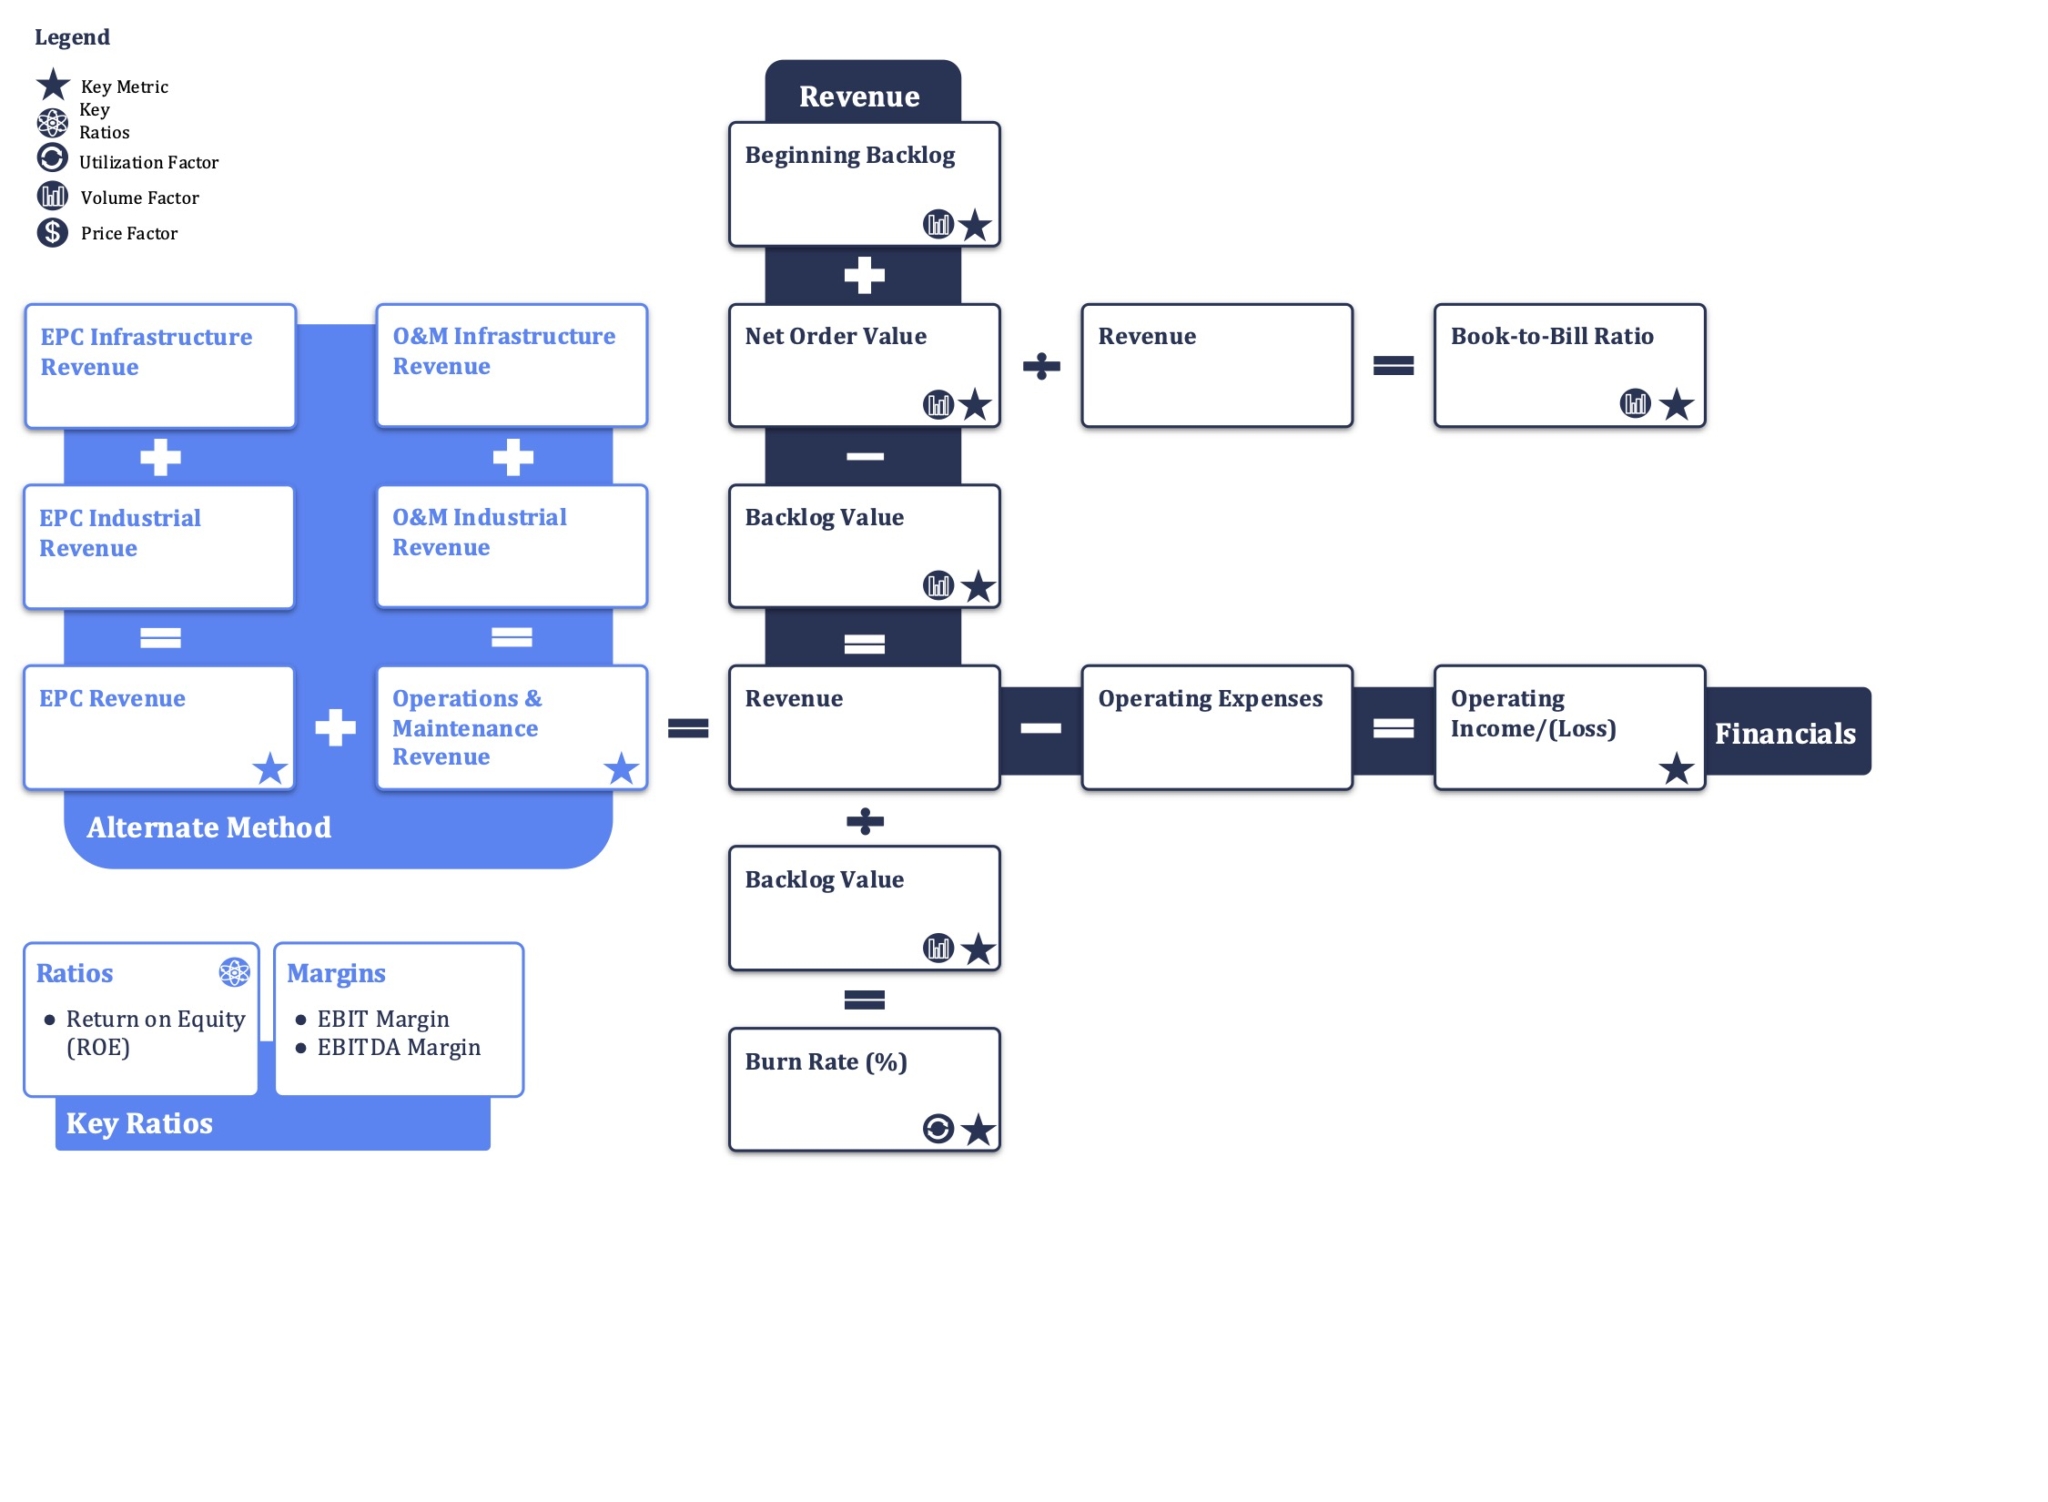
Construction & engineering (C&E) companies generate revenue through engineering, procurement, and construction (EPC) services, as well as operations and maintenance activities. Revenue is estimated based on orders and backlog data. Analysts calculate revenue for C&E companies based on the unique aspects of their business, such as project duration, contract type, project backlog, and the percentage of project completion. Key metrics considered in revenue estimation include:
- Backlog value: Analysts often start with a company’s project backlog, which is the total value of uncompleted projects that are contracted and expected to generate revenue in the future. The backlog acts as an indicator of future revenue and provides insight into the volume and timing of expected cash flows.
- Book-to-bill ratio: Book-to-bill ratio is the ratio of orders received to units shipped and billed for the period. Companies with a strong backlog turnover can convert more of their backlog into revenue within a given period, which analysts consider when projecting revenue growth.
- Net order value refers to the total value of orders received by a company during a specific period, minus any cancellations, returns, or adjustments. It provides insight into the demand for the company’s services or products and is particularly useful for construction and engineering companies to gauge the value of new contracts signed during the period.
Net order value is important because it helps analysts understand a company’s sales momentum and backlog growth, providing a clearer picture of future revenue and business performance.
- Burn Rate refers to the rate at which a company converts its backlog of contracted work into realized revenue. It is calculated by dividing the revenue earned during a given period (e.g., a quarter) by the backlog at the beginning of that period.
A higher burn rate signals efficient project execution and faster completion of contracted work, leading to improved cash flow and greater financial stability. Conversely, a lower burn rate may indicate delays or inefficiencies in fulfilling contracts.
Specifically construction & engineering revenue is calculated. Here’s how each term is defined:
- Beginning backlog: The value of work that was contracted but not yet completed at the start of the period.
- Net new orders: The value of new contracts secured during the period, often referred to as “Net order value.”
- Ending backlog: The value of work that remains contracted but uncompleted at the end of the period.
- Alternatively, construction and engineering revenue can also be calculated as the sum of EPC revenue and O&M revenue. Here EPC revenue is calculated as the sum of EPC revenue generated from infrastructure projects and industrial projects.
Profitability in this industry hinges on operational efficiency, strategic cost control, and managing substantial capital investments. Key profitability metrics include:
- Operating profit margin (EBIT margin) shows the percentage of revenue left after accounting for operating expenses such as salaries, rent, utilities, and depreciation. It reflects the company’s ability to manage overhead costs while running operations.
- EBITDA margin measures the operating profitability of a company without the influence of capital structure, tax rates, and depreciation. It’s particularly useful in assessing the cash-generating ability of a C&E company.
- Return on equity (ROE) assesses the profitability generated for shareholders relative to the equity invested in the company.
- Return on Invested Capital (ROIC) evaluates how efficiently the company generates returns from its invested capital, including debt and equity, highlighting overall capital efficiency.
Available Comp Tables - Consensus Estimates
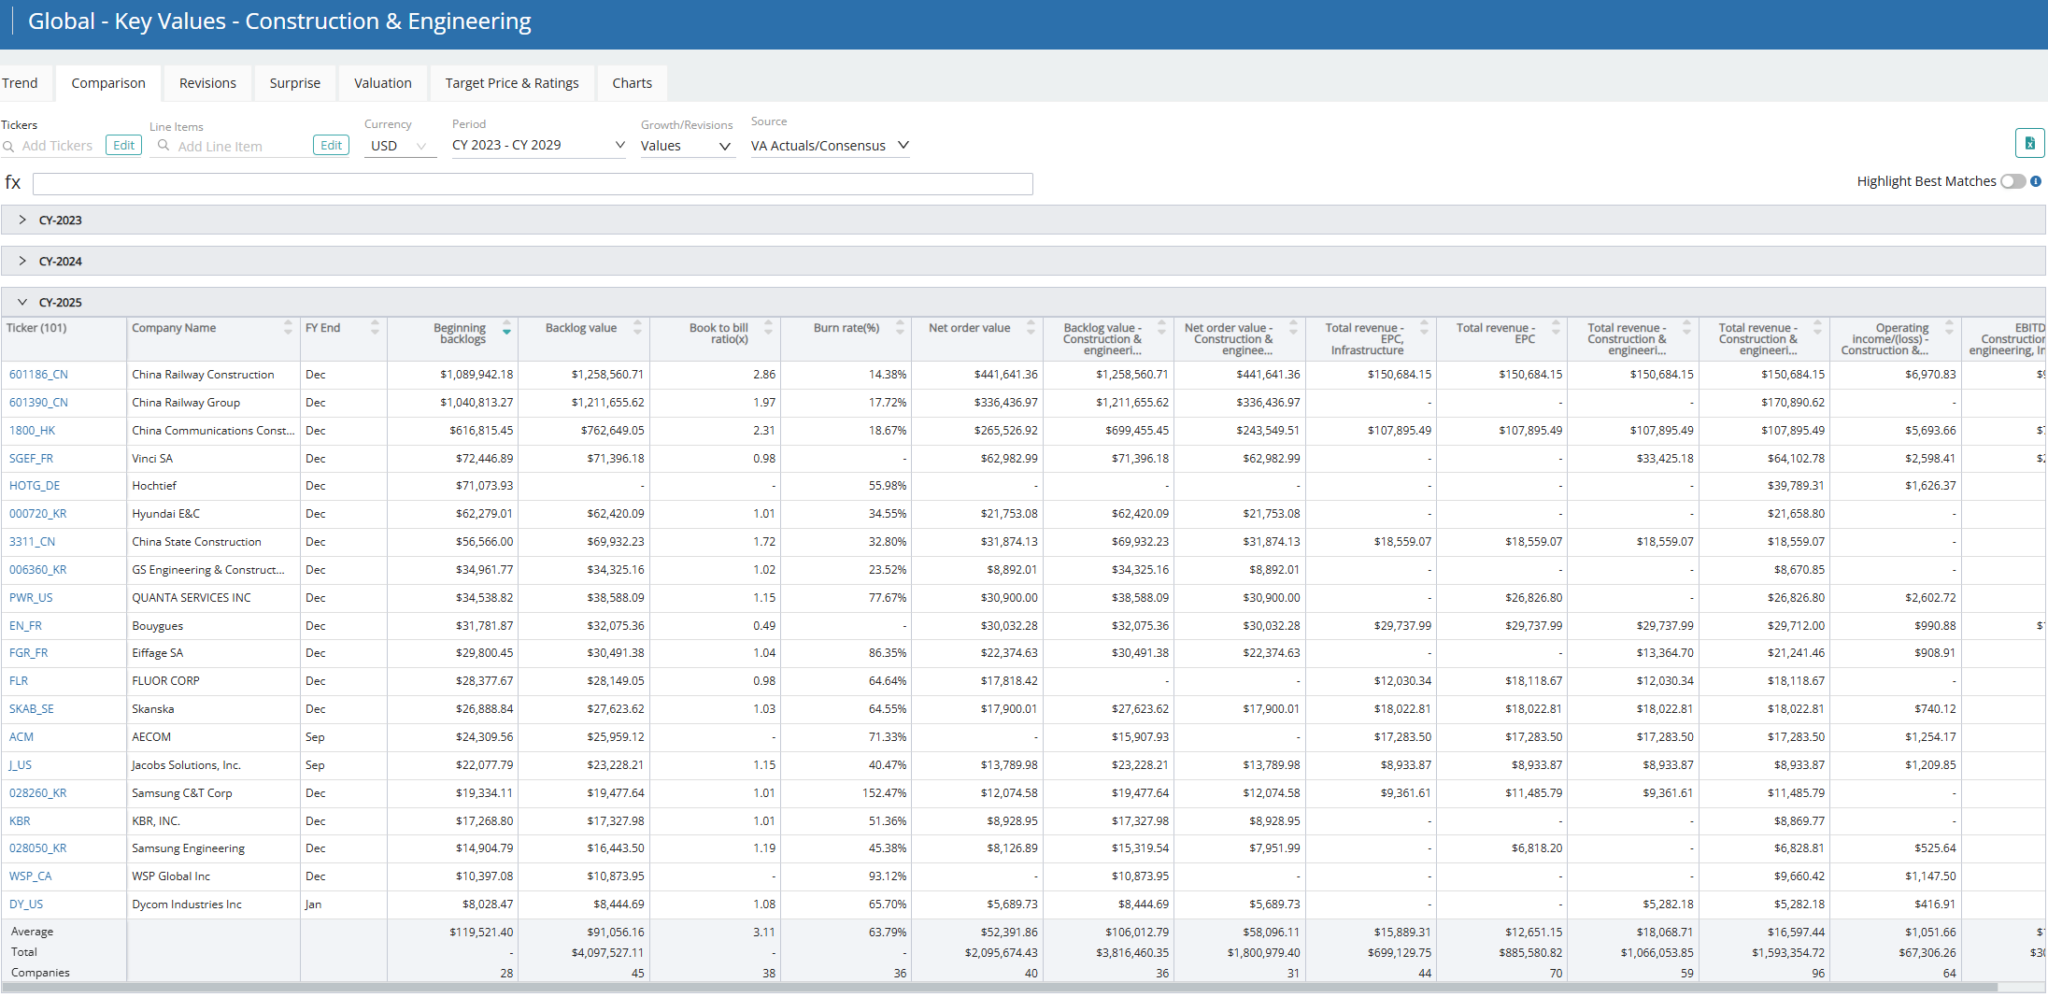
Visible Alpha offers 10 construction & engineering-related comp tables, comparing forecasts for key financial and operating metrics, to make it easy to quickly conduct relative analysis. Every pre-built, customizable comp table is based on region, sub-industry, or key operating metrics.
Global Financial and Operating KPIs Company Examples:
North America
- Quanta Services Inc: (NYSE: PWR)
- AECOM: (NYSE: ACM)
- Fluor Corporation: (NYSE: FLR)
- MasTec Inc: (NYSE: MTZ)
- WSP Global Inc: (TSX: WSP)
EMEA
- Vinci SA: (EPA: DG)
- ACS, Actividades de Construcción y Servicios, S.A.: (BME: ACS)
- Hochtief AG: (FRA: HOT)
- Bouygues SA: (EPA: EN)
- Eiffage SA: (EPA: FGR)
APAC
- China State Construction Engineering: (SHA: 601668)
- China Railway Group: (SHA: 601390)
- Hyundai Engineering & Construction: (KRX: 000720)
- Kajima Corporation: (TSE: 1812)
- Larsen & Toubro Ltd: (NSE: LT)
Download Report
This guide highlights the key performance indicators for the construction & engineering industry and where investors should look to find an investment edge, including:
- Construction & Engineering Industry Business Model & Diagram
- Key Construction & Engineering Industry Metrics PLUS Visible Alpha’s Standardized Industry Metrics
- Available Comp Tables
- Industry KPI Terms & Definitions