Featured Topics
Featured Products
Events
S&P Global Offerings
Featured Topics
Featured Products
Events
S&P Global Offerings
Featured Topics
Featured Products
Events
S&P Global Offerings
Featured Topics
Featured Products
Events
Financial and Market intelligence
Fundamental & Alternative Datasets
Government & Defense
Banking & Capital Markets
Economy & Finance
Energy Transition & Sustainability
Technology & Innovation
Podcasts & Newsletters
Financial and Market intelligence
Fundamental & Alternative Datasets
Government & Defense
Banking & Capital Markets
Economy & Finance
Energy Transition & Sustainability
Technology & Innovation
Podcasts & Newsletters
BLOG — Jul 04, 2022
By Ben Herzon and William Magee
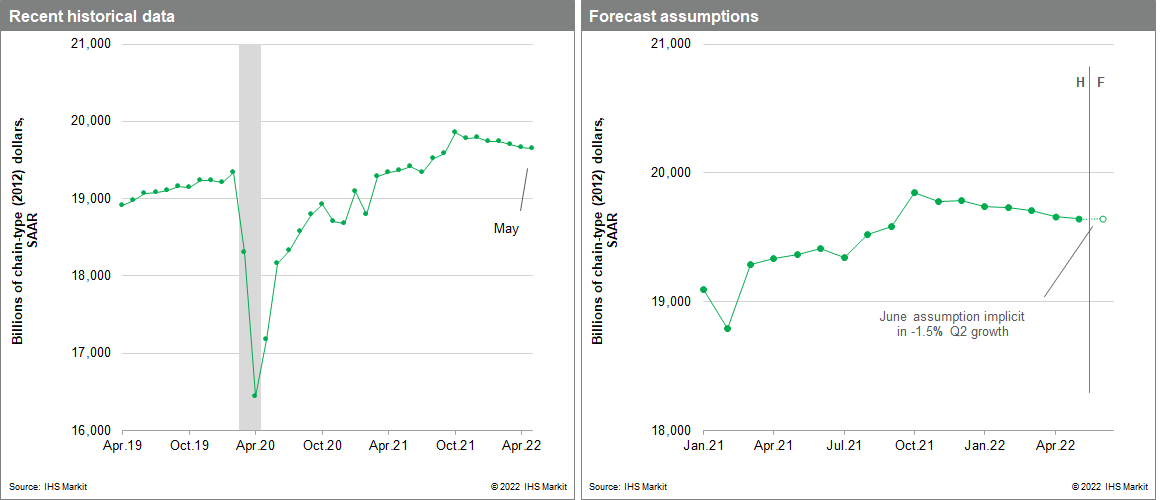
Monthly US GDP declined 0.1% in May on the heels of 0.2% declines over the prior two months. The April decline was revised materially lower from a previously estimated, 0.5% increase. The decline in May reflected declines in personal consumption expenditures, fixed investment (residential and nonresidential), and net exports that were partially offset by an increase in nonfarm inventory investment. Averaged over April and May, monthly GDP was 1.4% below the first-quarter average at an annual rate. Implicit in our latest estimate of a 1.5% annualized decline of GDP in the second quarter is roughly no change in monthly GDP in June.

Our index of Monthly GDP (MGDP) is a monthly indicator of real aggregate output that is conceptually consistent with real Gross Domestic Product (GDP) in the National Income and Product Accounts.

The Monthly GDP Index is consistent with the NIPAs for two reasons: first, MGDP is calculated using much of the same underlying monthly source data that is used in the calculation of GDP. Second, the method of aggregation to arrive at MGDP is similar to that for official GDP. Growth of MGDP at the monthly frequency is determined primarily by movements in the underlying monthly source data, and growth of MGDP at the quarterly frequency is nearly identical to growth of real GDP.
Posted 04 July 2022 by Ben Herzon, US Economist, Insights and Analysis, S&P Global Market Intelligence and
William Magee, Economist, Economics & Country Risk, S&P Global Market Intelligence
This article was published by S&P Global Market Intelligence and not by S&P Global Ratings, which is a separately managed division of S&P Global.