Featured Topics
Featured Products
Events
S&P Global Offerings
Featured Topics
Featured Products
Events
S&P Global Offerings
Featured Topics
Featured Products
Events
S&P Global Offerings
Featured Topics
Featured Products
Events
Financial and Market intelligence
Fundamental & Alternative Datasets
Government & Defense
Banking & Capital Markets
Economy & Finance
Energy Transition & Sustainability
Technology & Innovation
Podcasts & Newsletters
Financial and Market intelligence
Fundamental & Alternative Datasets
Government & Defense
Banking & Capital Markets
Economy & Finance
Energy Transition & Sustainability
Technology & Innovation
Podcasts & Newsletters
ECONOMICS COMMENTARY — Aug 04, 2023
The Global PMI data - compiled by S&P Global across over 40 economies and sponsored by JPMorgan - showed companies' costs rising at a slightly increased rate in July, the overall level of the survey's Prices Charged Index pointing to a "stickiness" of consumer price inflation in the months ahead.
Steeper upward prices pressures are emanating primarily from consumer-facing services providers, though the rate of deflation of goods prices has also moderated.
By far the most widespread cause of higher prices was rising staff costs, according to survey participants.
By country, besides Russia, the steepest price increase was seen in the UK, though the rate of inflation notably accelerated in the US, Australia and Japan. Prices continued to fall in mainland China.

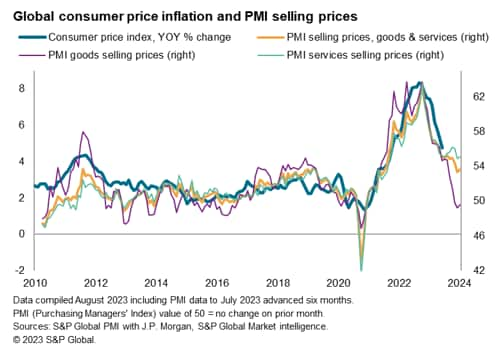
Consumer price inflation fell globally in June, according to S&P Global Market Intelligence calculations, dropping from 5.3% in May to 4.7%, its lowest since October 2021 and down sharply from the 8.3% peak seen in September 2022. Forward-looking survey data suggest the rate has further room to fall in the months ahead, albeit with any descent beyond 4% currently looking unlikely amid some signs of stickiness in the leading indicators.
The global PMI survey's selling price index - compiled by S&P Global and covering prices charged for both goods and services in all major developed and emerging markets - registered 53.6 in July. That was down almost ten points from the survey high of 63.5 recorded back in April 2022, but it's higher than the reading of 53.4 seen in June. The monthly rise in the index between June and July of this year therefore indicates that the rate of inflation accelerated slightly.
While it is always unwise to read too much into one month's data, the latest rise follows a mere 1.6 point fall in the index over the first half of 2023. That compares with a 4.6 point decline in the second half of 2022. In short, the speed of inflation's descent has slowed, and may even have stuck around the 4% level globally relative to a pre-pandemic decade average of 2.7%.
Note that the survey's prices charged gauge acts with around six months' lead on the annual rate of consumer price inflation, so the survey's recent trend hints at some further modest cooling of global inflation in the months ahead before the rate potentially ticks higher again at the turn of the year, running just under 4%.
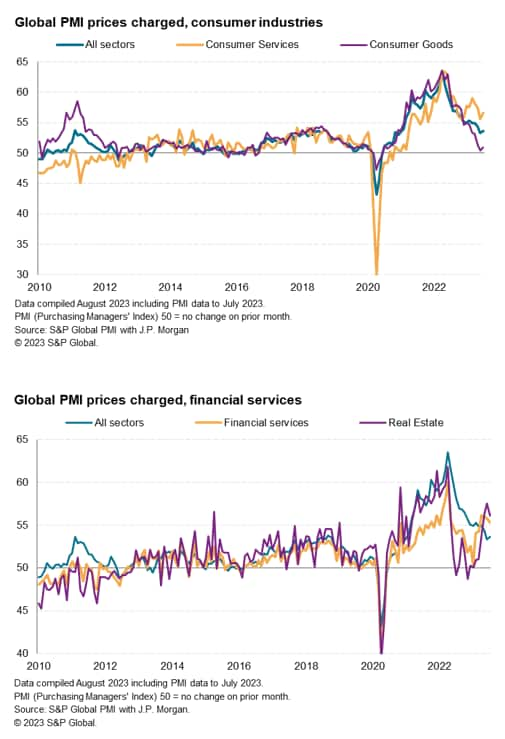
The stickiness of inflation is stemming primarily from the service sector. The PMI surveys showed average rates charged for services rose at a slightly increased rate in July, a pace which - although well below the peaks seen in 2022 - remains far higher than anything recorded by the survey prior to the pandemic. The current services PMI prices charged index reading of 55.1 compares with a pre-pandemic average of just 51.0.

While the news is much more encouraging from manufacturing, where average prices charged fell globally for a third month running in July, the latest fall was less marked than in June to signal a moderation in the rate of goods price deflation.
S&P Global's detailed sector PMI data allow further insights into the drivers of inflation. These data show that the steepest rise in prices charged in July was recorded for consumer services, where the rate of inflation accelerated in July. Within consumer services, travel and recreation saw the sharpest rise in prices in July, reflecting resurgent post-pandemic demand over the summer months.
Prices charged for healthcare also rose globally at an increased rate, with a strong - albeit reduced - rate of inflation also reported for financial services.
At the other end of the scale, prices fell most sharply for basic materials, reflecting increased discounting amid a glut of supply relative to weakened demand, all of which has been exacerbated by an ongoing drive towards inventory reduction as firms unwind safety stocks built up during the pandemic.
Part of the weakness of pricing power in manufacturing also reflects a post-pandemic shift in spending from goods to services, which has caused prices charged for consumer goods to barely rise over the past three months while prices for services have risen. The resulting divergence between prices charged for consumer goods relative to consumer services has reached unprecedented highs over the past four months. However, we note that prices charged for consumer goods rose at a marginally increased rate in July, and charges for basic materials fell at a reduced rate.
Looking at how the detailed sector PMI data changed between June and July is also illuminating. Prices charged indices fell in just 10 of the 27 sectors but rose in the remaining 17 to hint a relative broad-based rise in inflationary pressures during the month.


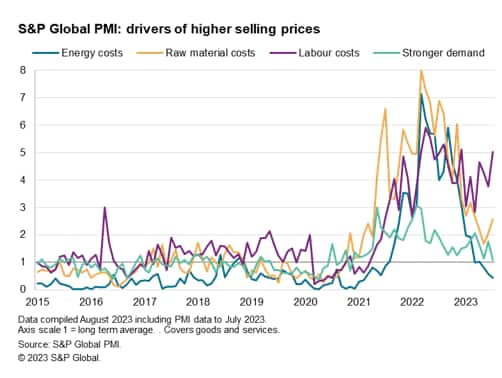
Analysis of the responses provided by PMI survey respondents can meanwhile be used to estimate the degree to which different factors are driving inflation. This information is derived directly from anecdotal evidence provided by companies to accompany the direction of change signaled for each survey variable. These data are presented as time series for which a value of 1.0 represents the long-run average.
These data inform us that by far the biggest upward pressure on selling prices for goods and services has been coming from wages so far this year, with the inflationary impact from labour costs intensifying further in July to run at five times the long run average. Upward pressures from raw material costs are running at over two-and-a-half times the long run average, up from under two-times their long run average in June (though well below the eight-times peak seen back in 2022). Demand-pull price pressures, on the other hand, have sunk close to their long-run average and the lowest since November 2020. Further respite also comes from energy price pressures, which are now running below the long-run average, down to the lowest since the pandemic lockdowns of early 2021.

Looking at the world's major economies, the steepest rates of PMI selling price inflation (measured across goods and services) was recorded in Russia followed by the UK. Only Italy and mainland China saw falling prices.
Note that faster rates of selling price inflation were recorded in Russia, Australia, the US and Japan, while the rate of deflation moderated in mainland China.
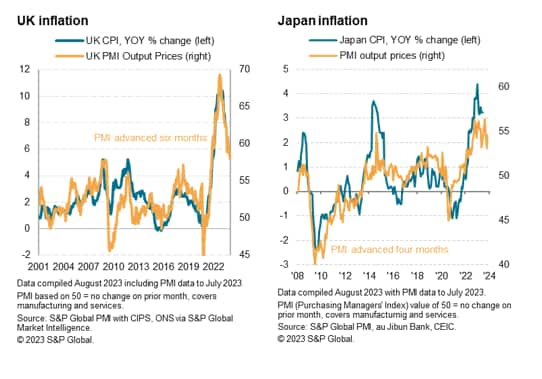
A notable stickiness of inflation above the pre-pandemic average is evident in Japan, albeit with the PMI index merely running at a level broadly indicative of 2% consumer price inflation. However, the US and Eurozone survey gauges are meanwhile consistent with inflation running around the 3% level, the former appearing particularly "sticky", and in the UK the index points to circa 5% inflation. In the UK, eurozone and US the PMI data therefore point to persistent above target inflation in the months ahead, albeit in the cases of the UK and eurozone with price pressures still trending lower in the latest survey period.


Chris Williamson, Chief Business Economist, S&P Global Market Intelligence
Tel: +44 207 260 2329
© 2023, S&P Global. All rights reserved. Reproduction in whole or in part without permission is prohibited.
Purchasing Managers' Index™ (PMI®) data are compiled by S&P Global for more than 40 economies worldwide. The monthly data are derived from surveys of senior executives at private sector companies, and are available only via subscription. The PMI dataset features a headline number, which indicates the overall health of an economy, and sub-indices, which provide insights into other key economic drivers such as GDP, inflation, exports, capacity utilization, employment and inventories. The PMI data are used by financial and corporate professionals to better understand where economies and markets are headed, and to uncover opportunities.
This article was published by S&P Global Market Intelligence and not by S&P Global Ratings, which is a separately managed division of S&P Global.
