Featured Topics
Featured Products
Events
S&P Global Offerings
Featured Topics
Featured Products
Events
S&P Global Offerings
Featured Topics
Featured Products
Events
S&P Global Offerings
Featured Topics
Featured Products
Events
Financial and Market intelligence
Fundamental & Alternative Datasets
Government & Defense
Banking & Capital Markets
Economy & Finance
Energy Transition & Sustainability
Technology & Innovation
Podcasts & Newsletters
Financial and Market intelligence
Fundamental & Alternative Datasets
Government & Defense
Banking & Capital Markets
Economy & Finance
Energy Transition & Sustainability
Technology & Innovation
Podcasts & Newsletters
ECONOMICS COMMENTARY — Jul 01, 2022
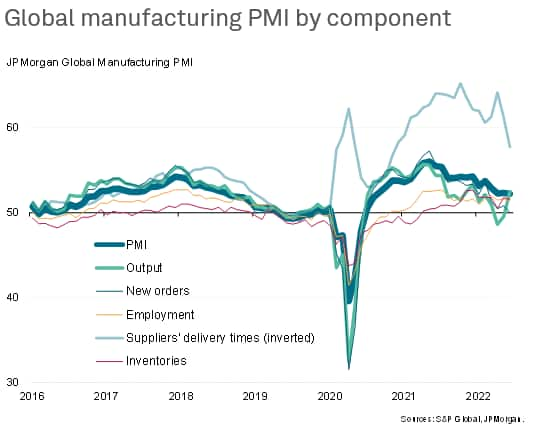
The JPMorgan Manufacturing Purchasing Managers' Index™ (PMI™), compiled by S&P Global, nudged lower in June, down from 52.3 in May to 52.2, its lowest since August 2020. The deterioration took place despite an easing of COVID-19 restrictions in China - which allowed mainland manufacturing activity to rise at the fastest rate for over a year - and reflected weakened factory trends in the US, Europe and across much of Asia.
More encouragingly, the alleviation of China's pandemic restrictions contributed to a further easing of supply chain delays, which - alongside a stalling of global demand growth for manufactured goods - helped cool price pressures, albeit with energy providing further upward pressure on costs.
A further downturn in business expectations for future output, alongside some key forward-looking indicators from the survey sub-indices, meanwhile hints at further manufacturing weakness in the coming months, along with a commensurate hint of further weaker price pressures.
In this analysis we look beyond the headline PMI to provide deeper insights into the current health of manufacturing around the world and the outlook for goods price inflation.
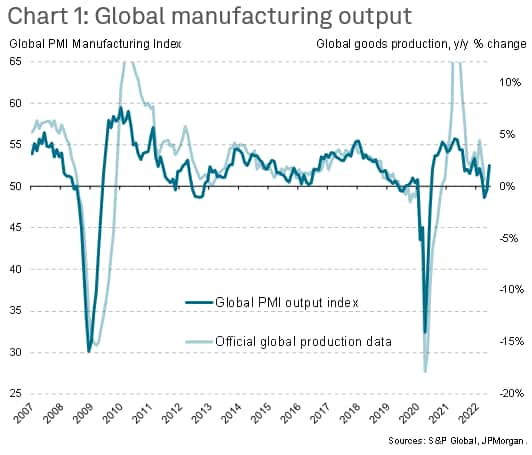
The global manufacturing PMI survey's Output Index, which acts as a reliable advance indicator of actual worldwide output trends several months ahead of comparable official data (see chart 1), registered an increase in production for the first time in three months in June. The rate of growth signalled is commensurate with annual production growth of approximately 2.5% and was the strongest recorded since last December.
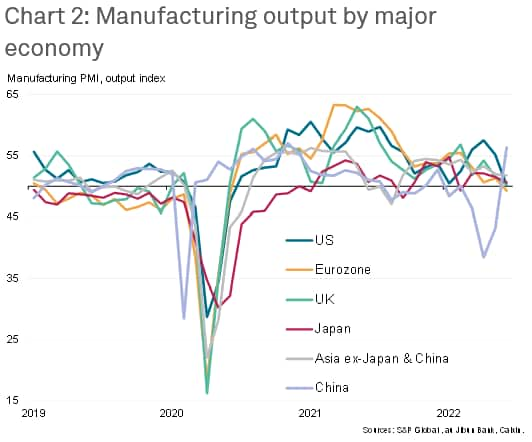
However, production trends varied markedly around the world in June. Of the major economies, only mainland China reported an improving production trend, with output rebounding sharply from three months of lockdown-induced contraction to register the strongest expansion since November 2020. it was also one of the strongest expansions seen for over a decade.
In contrast, output fell into decline in the eurozone for the first time in two years and came close to stalling in both the United States and United Kingdom, where steep slowdowns led to the worst performances for over two years.
Japan likewise reported near-stalled production growth, its worst performance since January's Omicron-related restrictions had led to a mild downturn. Meanwhile, the rest of Asia as a whole suffered the weakest expansion since the COVID-19 Delta wave disruptions of August 2021.
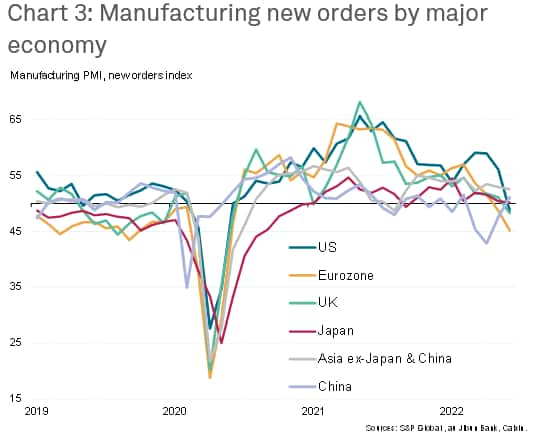
Growth of new orders likewise generally deteriorated, with declines registered in the eurozone, US and UK. Even China only saw a modest revival of demand, and near-stagnation was seen in Japan and across the rest of Asia as a whole. Notably, in all cases bar the latter, new orders growth fell below that of output.
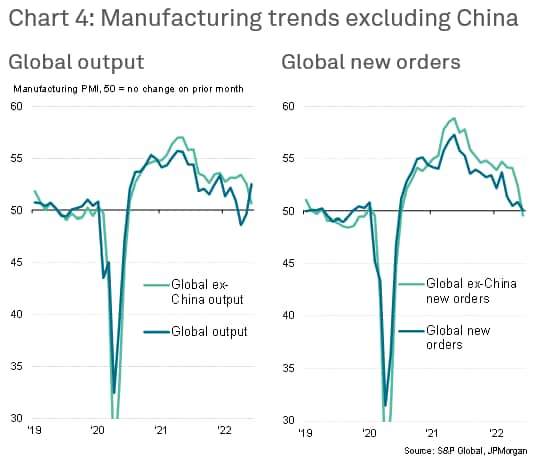
Excluding the rebound recorded in China, the global factory trend therefore looked less impressive. In fact, excluding China, factory output growth came to a near standstill in June, registering the weakest performance since June 2020, while new orders fell for the first time in two years.
It's notable that, even with China included, global new orders barely rose in June, underscoring how China's upturn appears to have largely reflected a re-opening of production and supply capabilities rather than any fundamental improvement in demand conditions, which appear to have deteriorated globally.
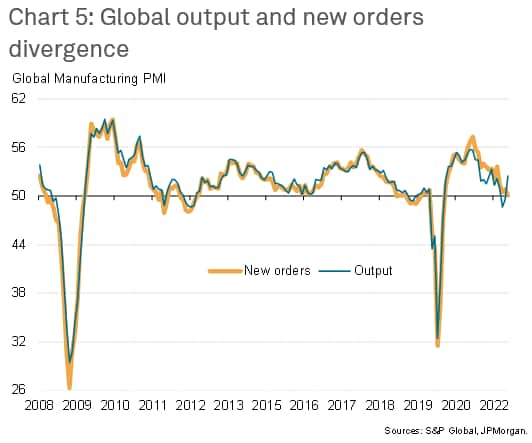
The resulting June global divergence of factory output and new orders is usually high (see chart 5), which is observed most prominently with the inclusion of China but is also running at the highest for two years even if China is excluded from the comparisons.
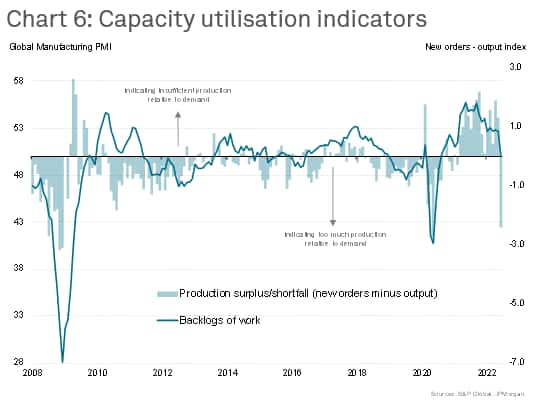
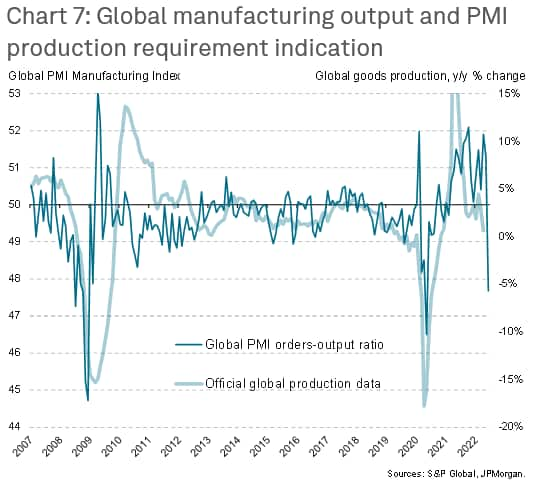
This divergence between output and new orders, the latter acting as a proxy for demand, provides signals with regard to capacity utilisation within manufacturing. As chart 6 illustrates, new orders are lagging output growth to an extent only exceeded in recent history by the depths of the global financial crisis and the initial months of the pandemic, pointing to a marked excess of production over demand. This thereby hints at falling production in coming months (chart 7).
Similarly, global backlogs of work (orders received but not yet completed by manufacturers) stopped growing in June for the first time in two years, underscoring the extent to which the demand recovery appears to be faltering.
June also saw an increase in the number of companies reporting rising inventories of unsold stock due to weaker than expected final sales. Although inventories overall were unchanged from May, there is a long-term trend of cost-driven inventory reduction evident in the manufacturing sector, meaning rising inventory levels are extremely rare. June was in fact the first time since March 2019 that inventories of finished goods failed to decline (chart 8).
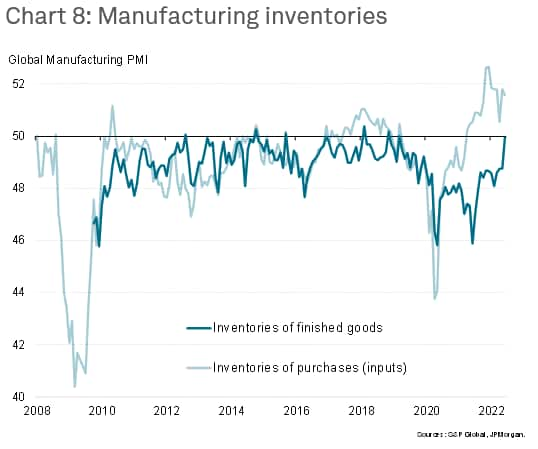
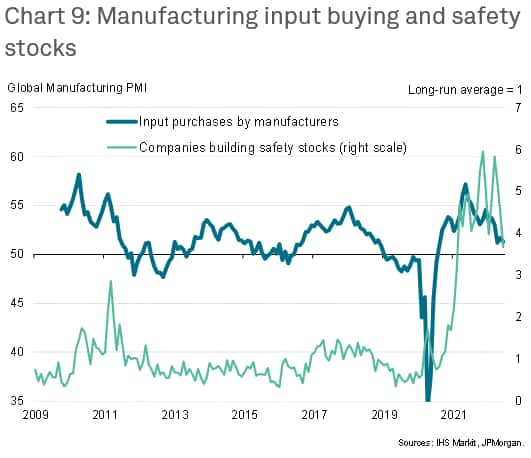
Similarly, inventories of inputs rose sharply due in part to an increase in the number of companies reporting that fewer inputs were used in production than had been anticipated. Although there is also evidence of continued stock accumulation in some firms where future supply shortages are feared, the incidence of companies building up safety stocks has also fallen, and is now running at the lowest since February 2021.
Measured overall, input buying by manufacturers consequently grew in June at one of the slowest rates seen over the past two years (see chart 9).
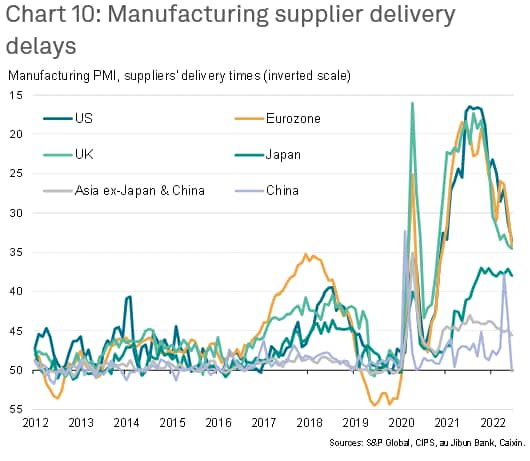
With the Chinese authorities easing some COVID-19 restrictions in June, supplier lead times improved - albeit only marginally - in China for the first time since December 2018. However, the incidence of supplier delays meanwhile also eased in the US, UK, Eurozone, Japan and the rest of Asia as a whole, reflecting a combination of improved supplier performance, easing shipping delays and weaker demand.
The reduced number of supply delays had a beneficial effect on prices charged by these suppliers to manufacturers. However, in some cases, weaker demand for inputs shifted pricing power from the supplier to the buyer. Input price inflation consequently moderated in all major economies with the exception of China, where the rate of inflation nonetheless remained especially modest.
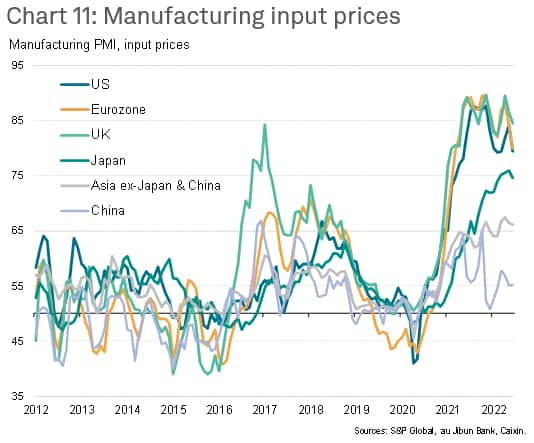
Collectively, the global manufacturing sector consequently saw the smallest degree of supplier delays since November 2020 as well as an overall moderation of input cost inflation to the lowest since February. However, with supply delays remaining elevated by historical standards despite the latest improvement, the overall rate of input cost inflation likewise remained high. Nonetheless, with demand having now stalled, even including China's 'rebound', prices are clearly likely to come under further downward pressure.

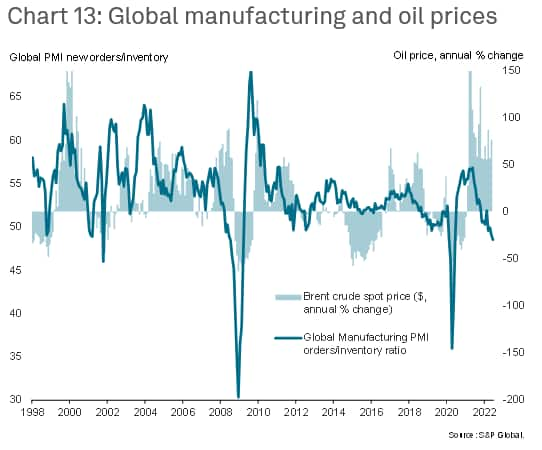
One area of persistent upward pressure on prices has been energy, prices for which have soared since Russia's invasion of Ukraine with further supply problems threatening to present ongoing issues in Europe as the year goes on. As chart 13 suggests, the oil price remains high despite the recent cooling of demand growth, which is very unusual. Thus, any signs of the conflict easing in Ukraine could therefore lead to a material weakening of price support to oil and energy more broadly.
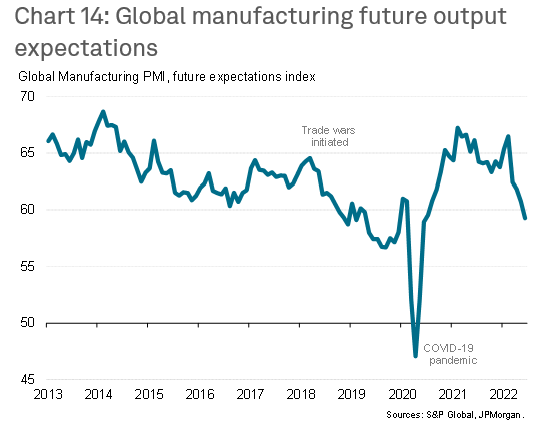
Looking ahead, manufacturing optimism deteriorated further in June, dropping to its lowest since June 2020 and is now running below the long-run trend for the third successive month. Companies reported growing concerns over the economic outlook, the rising cost of living, the Ukraine war and rising interest rates. These issues stand as key downside risks which point to no imminent improvement in the overall global manufacturing picture, but therefore also bodes well for further downward pressure on prices. However, concerns stemming from future supply shortages and an intensification of the Ukraine war could led to persistent price inflation for some key inputs including energy and food.
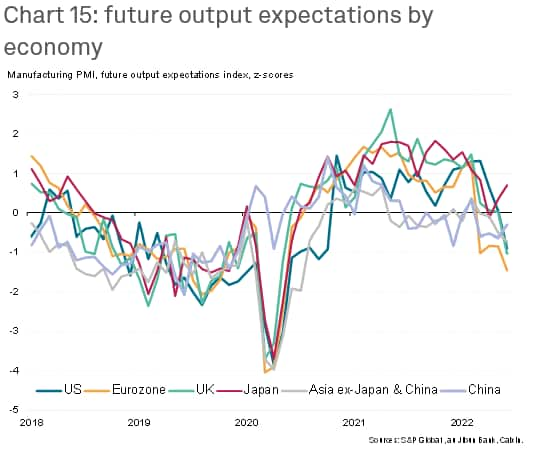
Compared to long-run averages, business confidence was again especially weak in the eurozone in June, reflecting the proximity of the Ukraine war and rising worries over energy supply in particular, but has also weakened considerably in the US, the UK and in Asia, with notable exceptions of China and Japan.
Chris Williamson, Chief Business Economist, S&P Global Market Intelligence
Tel: +44 207 260 2329
chris.williamson@spglobal.com
© 2022, IHS Markit Inc. All rights reserved. Reproduction in whole or in part without
Purchasing Managers' Index™ (PMI™) data are compiled by IHS Markit for more than 40 economies worldwide. The monthly data are derived from surveys of senior executives at private sector companies, and are available only via subscription. The PMI dataset features a headline number, which indicates the overall health of an economy, and sub-indices, which provide insights into other key economic drivers such as GDP, inflation, exports, capacity utilization, employment and inventories. The PMI data are used by financial and corporate professionals to better understand where economies and markets are headed, and to uncover opportunities.
This article was published by S&P Global Market Intelligence and not by S&P Global Ratings, which is a separately managed division of S&P Global.
Location
