Featured Topics
Featured Products
Events
S&P Global Offerings
Featured Topics
Featured Products
Events
S&P Global Offerings
Featured Topics
Featured Products
Events
S&P Global Offerings
Featured Topics
Featured Products
Events
Financial and Market intelligence
Fundamental & Alternative Datasets
Government & Defense
Banking & Capital Markets
Economy & Finance
Energy Transition & Sustainability
Technology & Innovation
Podcasts & Newsletters
Financial and Market intelligence
Fundamental & Alternative Datasets
Government & Defense
Banking & Capital Markets
Economy & Finance
Energy Transition & Sustainability
Technology & Innovation
Podcasts & Newsletters
ECONOMICS COMMENTARY — Sep 01, 2022
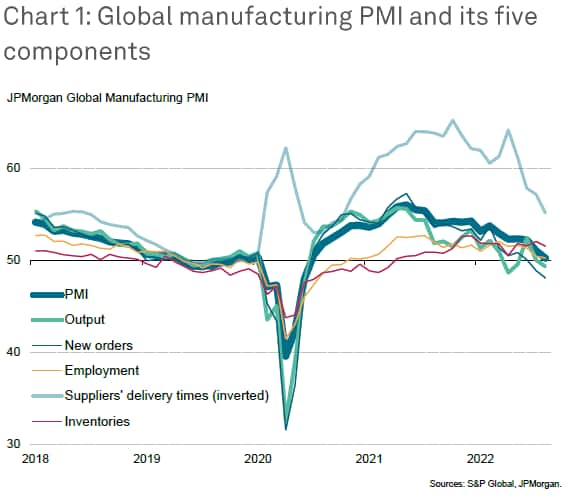
The JPMorgan Global Manufacturing Purchasing Managers' Index™ (PMI™), compiled by S&P Global, fell from 51.1 in July to 50.3 in August, its lowest since June 2020.
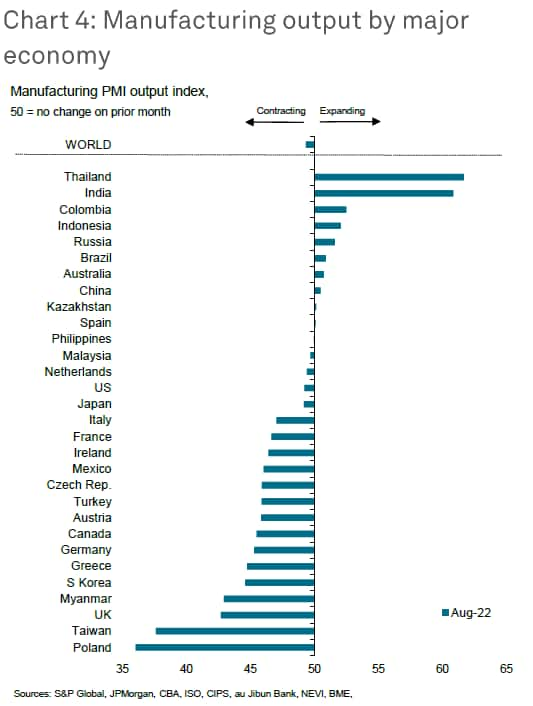
Output only rose in ten of the 30 economies for which data are available, and in five of those - including mainland China - the gains were only marginal. Production losses were meanwhile recorded in the United States, Eurozone, UK and Japan.
The survey's sub-indices, explored further in this paper, point to the production trend deteriorating in the coming months. Most notably, new orders continued to fall at an increased rate in August, and inventory levels continued to rise amid weaker than anticipated sales.
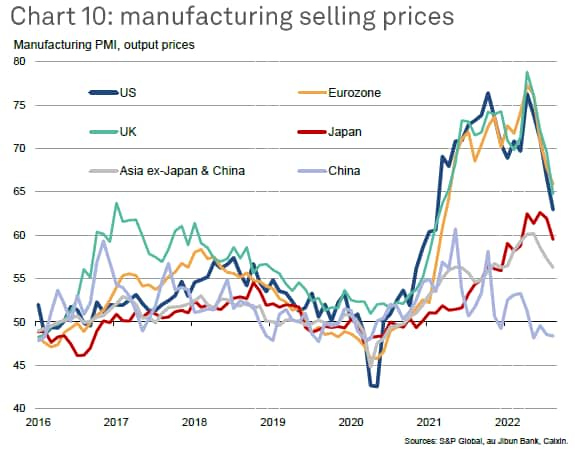
There was encouraging news on the inflation front, however, as weakening demand and improving supply led to a marked cooling of price pressures in the factory sector, with pricing power shifting from sellers to buyers.
Global factories set for steepening downturn
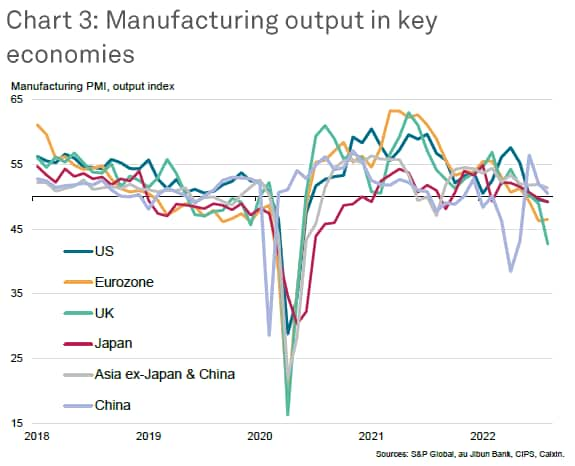
The global manufacturing PMI survey's Output Index, which acts as a reliable advance indicator of actual worldwide output trends several months ahead of comparable official data (see chart 2), signaled a marginal drop in worldwide factory production in August, the third such decline seen over the past five months.
However, while modest at present, the downturn look set to gather momentum in the months ahead given marked deteriorations in other survey variables. Most importantly, the new orders to inventory ratio, a useful guide to near-term production trends, fell further in August, dropping to a level which, besides the initial pandemic lockdown months, was the lowest since April 2009, at the height of the global financial crisis.

It is also noteworthy that, whereas the modest decline in output seen in April and May were driven largely by COVID-19 lockdown measures in mainland China, August's decline is more broad based. Of the 30 economies for which S&P Global PMI data are so far available for August (Vietnam is published on 5th September), only ten reported an increase in production. Furthermore, of these ten, only marginal gains were seen in five countries. In fact, output rose to any noteworthy extent only in Thailand and India, albeit with further modest but significant gains seen in Colombia, Indonesia and Russia (the latter enjoying a rebound in domestic demand).
Output meanwhile fell especially sharply in the UK, where the loss was only exceeded by the declines registered in Taiwan and Poland, as well as in the eurozone. Moderate declines were meanwhile seen in the US and Japan, while growth in mainland China slowed close to stalling after two months of post-'lockdown' rebound.
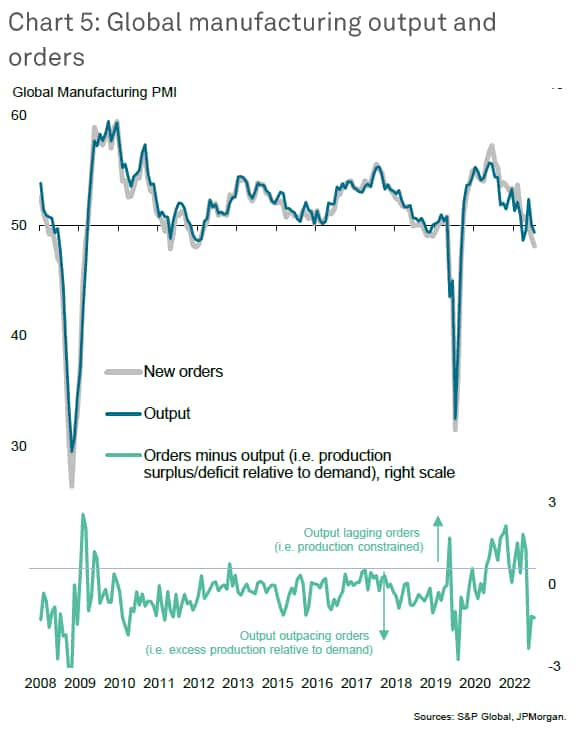
To further understand the near-term trajectory of manufacturing output we first need to assess the health of current demand, and in this respect the latest PMI survey data showed inflows of new orders falling at an increased rate in August. The decline was in fact one of the largest seen over the past decade, albeit far smaller than the drops seen in the initial stages of the pandemic, and - importantly - exceeded the drop in output. This divergence between output and new orders in recent months (see chart 5) suggests that, absent a sudden revival in demand, manufacturers will need to adjust output down further in the coming months in line with the new, weaker, demand environment.
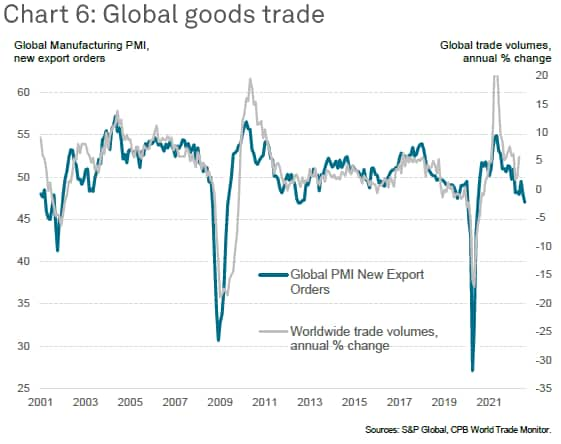
The deteriorating demand picture can in part be traced to a steepening downturn in global trade, as measured by the global PMI's new export orders index, which correlates well with official trade statistics, which are only available with a significant delay.
Chart 6 demonstrates the predictive power of the PMI export orders data against global trade, and points to trade flows falling in August at a rate not seen since the debt crisis of 2012 (excluding the early pandemic months).
Exports losses were recorded during August in the US, Eurozone, UK, Japan and mainland China. In fact only India, and to a lesser degree Australia, reported any export growth in August.
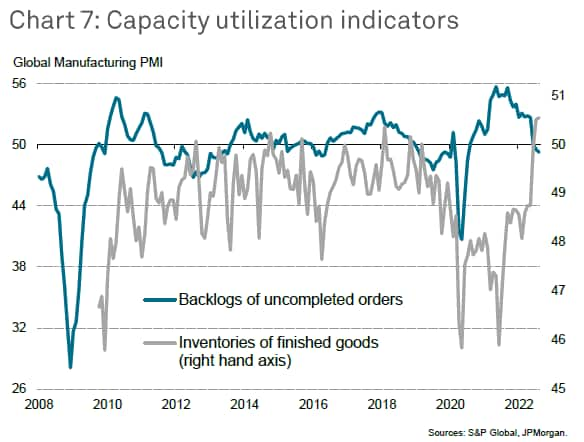
Dig down deeper into the survey data and the worrying signals start to multiply. There are two key indicators in particular which point to excess capacity developing in the manufacturing sector, reflective of the weakening of demand in recent months.
Frist, backlogs of orders (work in hand but not yet completed) fell for a second successive month. This marks a strong contrast with the record increases in backlogs of work seen during particularly busy spells over the past two years, which in turn reflected demand running ahead of production capabilities. In recent months, there is a reversal of this trend, with production capacity now running ahead of demand, meaning companies have been able to reduce their backlogs of work.
Second, inventories of finished goods rose in August at a rate unprecedented since comparable data were available in 2009, building on a prior record gain in July. This stock accumulation primarily reflects lower than expected sales and shipments to customers, rather than a deliberate stock-building, according to anecdotal evidence provided by survey contributors.
Such a stock build-up, alongside falling backlogs of work, suggests that companies will adjust production down in the months ahead.
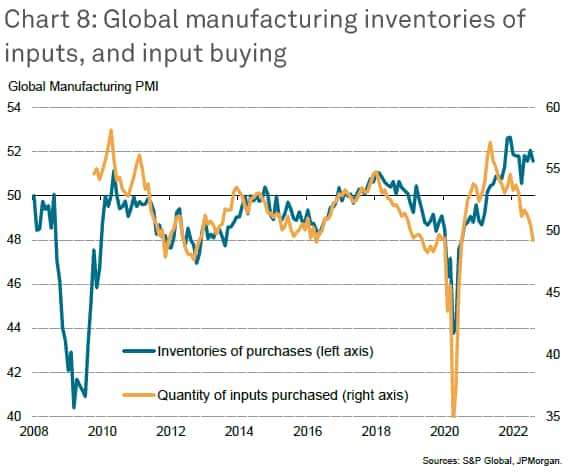
Inventories of raw materials and other inputs are also rising at a rate seldom witnessed prior to the pandemic. However, whereas inventories of inputs were rising in 2021 due to deliberate stock building as producers focused on supply chain resilience, recent months have seen a growing number of companies report that inventories are now rising due to lower than anticipated use in production, in turn linked to disappointing sales levels.
In fact, inventories are now rising despite producers cutting back on their purchases of inputs, underscoring how low production levels are meaning warehouses are filling with unused raw materials.
A consequence of the recent fall in demand for goods and manufacturers' accompanying drop in demand for inputs has been an easing of supply constraints. Reports of longer supplier delivery times fell globally in August to the lowest for 22 months, with the incidence of delays running far lower than seen during much of the pandemic recovery period.
With demand falling and supply constraints easing, there has been a commensurate cooling of price pressures, as clearly demonstrated by chart 9. Many suppliers are offering better rates in order to sell unsold stock to manufacturers, and manufacturers themselves - often encumbered with planned high levels of inventory - are now often reluctant buyers.
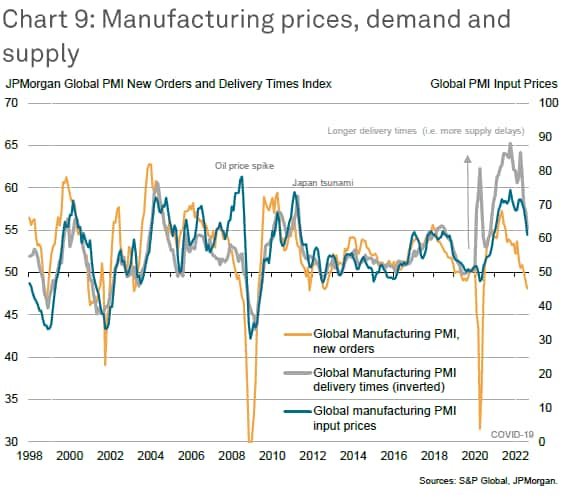
Similarly, manufacturers are increasingly willing to reduce prices to win sales in the increasingly tough demand environment. Average prices levied for goods leaving the factory gate rose at the slowest rate for a year and a half in August as a result. Steep moderations in rates of selling price inflation were evident in the US, Eurozone and UK, as well as in Japan, with prices even continuing to fall in mainland China.
In short, pricing power is shifting from sellers to buyers as the manufacturing sector faces a period of falling demand and reduced production.
Chris Williamson, Chief Business Economist, S&P Global Market Intelligence
Tel: +44 207 260 2329
chris.williamson@spglobal.com
© 2022, IHS Markit Inc. All rights reserved. Reproduction in whole or in part without permission is prohibited.
Posted 01 September 2022 by Chris Williamson, Chief Business Economist, S&P Global Market Intelligence
Purchasing Managers' Index™ (PMI™) data are compiled by IHS Markit for more than 40 economies worldwide. The monthly data are derived from surveys of senior executives at private sector companies, and are available only via subscription. The PMI dataset features a headline number, which indicates the overall health of an economy, and sub-indices, which provide insights into other key economic drivers such as GDP, inflation, exports, capacity utilization, employment and inventories. The PMI data are used by financial and corporate professionals to better understand where economies and markets are headed, and to uncover opportunities.
This article was published by S&P Global Market Intelligence and not by S&P Global Ratings, which is a separately managed division of S&P Global.
