Featured Topics
Featured Products
Events
S&P Global Offerings
Featured Topics
Featured Products
Events
S&P Global Offerings
Featured Topics
Featured Products
Events
S&P Global Offerings
Featured Topics
Featured Products
Events
Financial and Market intelligence
Fundamental & Alternative Datasets
Government & Defense
Banking & Capital Markets
Economy & Finance
Energy Transition & Sustainability
Technology & Innovation
Podcasts & Newsletters
Financial and Market intelligence
Fundamental & Alternative Datasets
Government & Defense
Banking & Capital Markets
Economy & Finance
Energy Transition & Sustainability
Technology & Innovation
Podcasts & Newsletters
Research — Sept 30, 2024
By Adam Wilson and Tony Lenoir
As the datacenter industry continues its whirlwind growth, energy access remains the key hurdle for owners and developers. Energy access refers not just to power generation, however, but also to transmission and distribution infrastructure to transport that power to load centers. As evidenced by both rising curtailment in several regions and overcrowded interconnection queues, grid constraints are an increasingly formidable hurdle with which datacenter owners must contend in assessing new areas for development.

With renewable energy developers deploying record amounts of solar and wind capacity in the US on the back of the Inflation Reduction Act of 2022, all eyes are now turning to grid adequacy, transmission bottlenecks and rising curtailment levels.
Fast-steepening projections for datacenter energy demand — now expected to top 760.7 TWh annually by 2029, up from an estimated 371.6 TWh in 2024 — are magnifying these issues, particularly in geographies expected to experience significant datacenter IT capacity expansions, notably Electric Reliability Council of Texas and the US southeast, where relatively short mileages of transmission lines are currently planned.
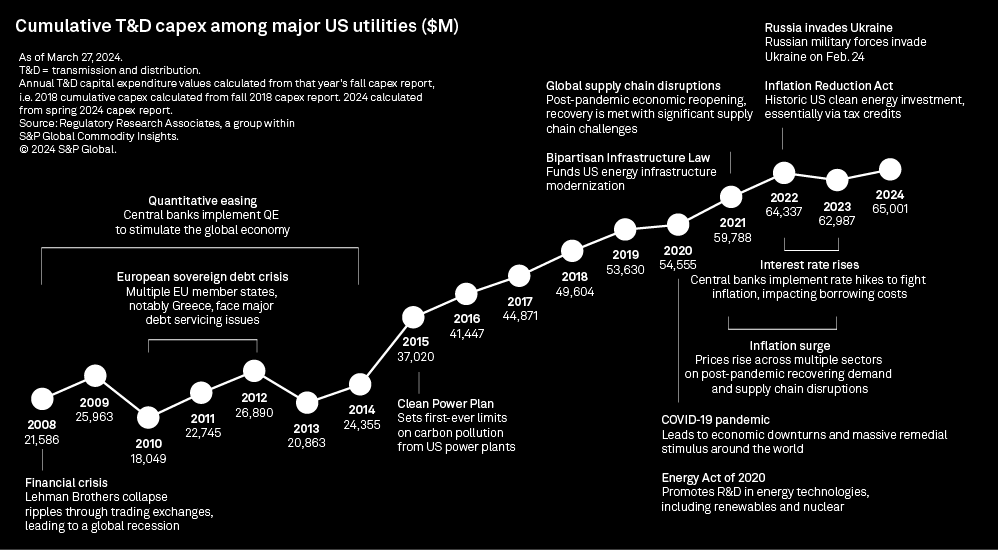
Investments by major utilities to upgrade the US grid rose steadily between the end of the 2000s through 2022. This interval, however, was a period of relatively subdued energy demand growth. Transmission and distribution (T&D) capital expenditure has plateaued in the past two years, impacted by the post-COVID-19 pandemic inflation surge, and central banks' monetary policy to fight it. Now that US inflation is receding, policymakers are turning their sights to energy transportation; with all major energy players recognizing the urgency posed by the datacenter boom, the probability of a new leg-up has increased.


Rising curtailment — risk or opportunity
Given the unpredictability of wind and solar power's energy sources, both types of generation are subject to curtailment — the purposeful reduction of power output from power plants as mandated by grid operators. While curtailment can happen for a variety of reasons, most commonly it is simply a result of wind or solar plants in a given region producing more power than what is needed at that time. While this excess renewable generation is seemingly there for the taking, regions with high curtailment rates likely represent more risk than reward for climate-conscious hyperscalers and datacenter developers.
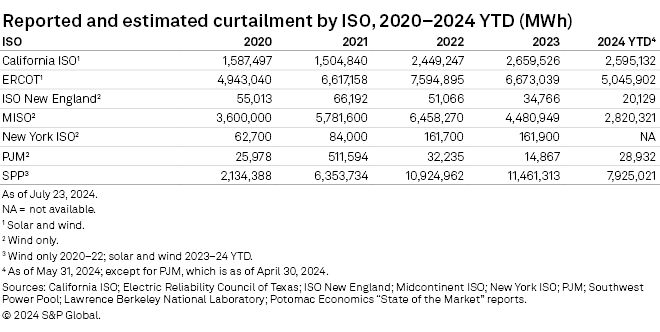
High curtailment is often an indicator of regional T&D constraints as the grid lacks suitable infrastructure to sufficiently transport abundant wind and solar generation across the region. Such constraints could signal infrastructure shortfalls hindering the interconnection of new high-load facilities such as datacenters. Curtailment rates through May 2024 are increasing across California ISO , Electric Reliability Council of Texas Inc., Southwest Power Pool and Midcontinent ISO. These four independent system operators have cumulative interconnection queue capacities ranging from 115 GW to over 500 GW, highlighting the interconnection backlog in these regions.

Rising energy demand — due, in part, to datacenter growth and electrification — is linked to curtailment reduction in certain regions such as ERCOT. The main benefactor, however, is likely owners of the renewable assets themselves, as grid operators are still forced to contend with variable generation shortfalls against rising demand across an aging energy grid. And datacenters, hungry for clean power, can only leverage this excess renewable generation sporadically as curtailment varies significantly depending on the season and the time of day.
Transmission and distribution investment keeping pace?
Upgrading the US electrical grid remains a key focus for utilities and legislators alike. This area of the energy sector is fraught with obstacles, including red tape, long planning and development timelines, and opposition from communities wary of visual pollution. The Biden-Harris administration dedicated $10.5 billion toward addressing these hurdles as well as upgrading and expanding the energy grid, which — in addition to other benefits — would help with curtailment reduction and grid interconnection delays. Renewable energy investment has skyrocketed since the passing of the Inflation Reduction Act of 2022, but these clean energy projects are running into bottlenecks, starting with an outdated energy grid unequipped to handle such a large influx of variable generation.
Utilities are working to address this problem, however. S&P Global's April 2024 utility capital expenditure update tagged roughly $65 billion in T&D capex among major utilities in 2024 alone. This is triple what utilities were spending 16 years ago on an unadjusted basis. Historical trends in utility T&D capex since 2008 show varying degrees of annual investment as macroeconomic forces such as the Great Recession in the late 2000s slowed spending across the industry. In the 2010s, T&D investment rose steadily as a more favorable economic climate and increased clean energy and grid modernization initiatives took hold, with utility T&D spending rising from $20.9 billion to $64.3 billion between 2013 and 2022.

Electrical grid expenditure amongst utilities has seemingly flattened since 2022, with 2024 investment just over $65 billion. Inflation, global supply chain woes and high interest rates likely contribute to the slowing pace of T&D capital investment. It is also important to note that this spending is not solely dedicated to new infrastructure. Operations and maintenance costs of existing lines account for between 35% and 45% of annual T&D spending. Further, a significant portion of new investment is toward extreme weather and wildfire mitigation measures; this is a critical need for utilities but does little to manage new load growth or help new power projects working through long interconnection queues.
Electrification, the rapid deployment of renewables, rising curtailment rates and a sustained datacenter boom — datacenter power consumption is projected to more than double from 2024 through 2029, according to S&P Global Market Intelligence 451 Research — are shining a light on the US transmission network. In fact, the system could be the primary chokepoint hindering all these transformations. Stagnating investment among utilities could be a sign that grid infrastructure is set to fall further behind industry demand. New project developments in key markets, however, could help ease near-term concerns.
Project development and datacenter markets
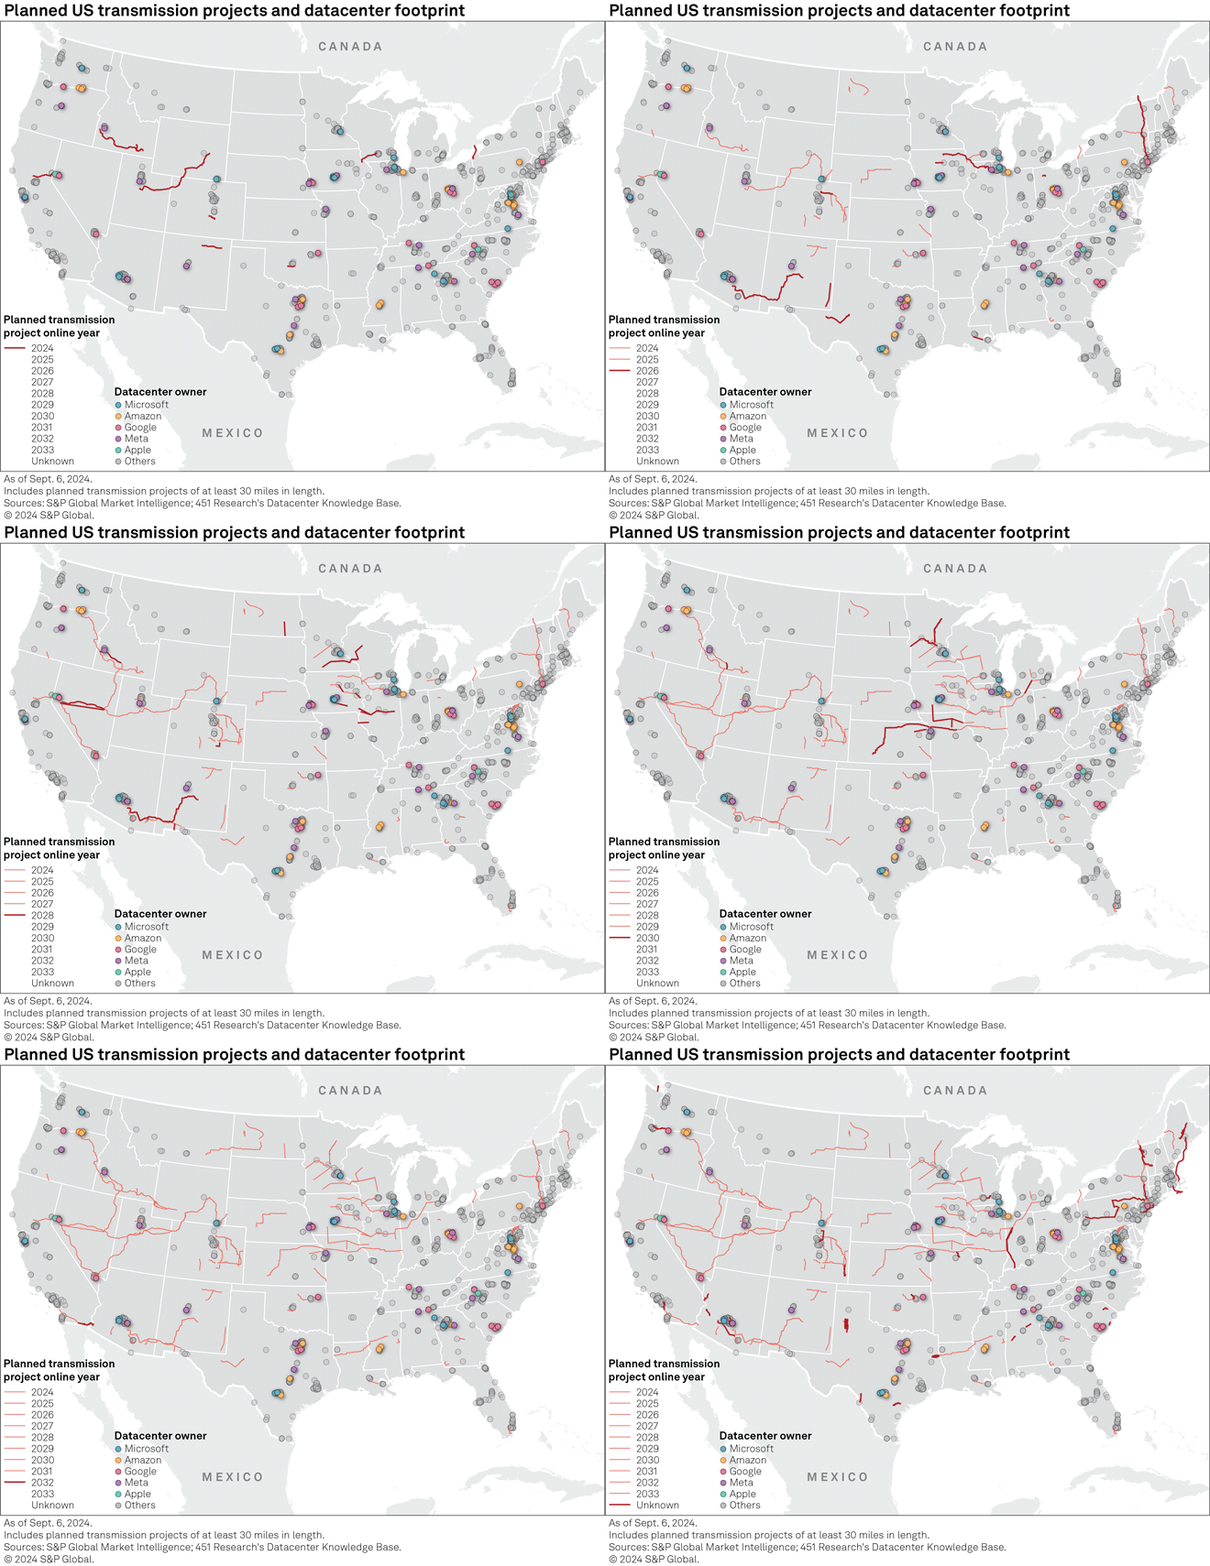
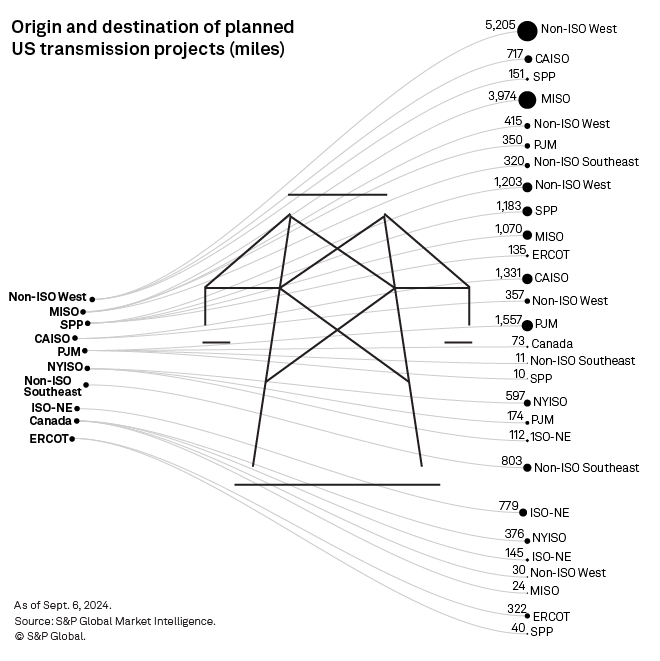
S&P Global Market Intelligence data shows over 21,400 miles of transmission line projects currently in the works in the US. This includes an operating 2,759 miles being upgraded or rebuilt and 18,705 miles of new transmission lines to be added to the grid. Over 47% of the new infrastructure is to enter service from 2025 through 2028, according to Market Intelligence data. That said, projected online years are unavailable for new projects totaling 3,502 miles, or 18.7% of the new US transmission lines currently planned.
More than 73% of the planned new transmission lines are to originate in three regions: the non-ISO West (29.9%), MISO (26.5%) and SPP (16.7%). Nearly 85% of the new transmission line projects originating in the non-ISO West are to channel electricity within the region, with CAISO making up the bulk of the balance. An additional 1,826 miles of planned new transmission infrastructure are to transport power into the non-ISO West from the outside, making the region the largest beneficiary of new US transmission infrastructure in the pipeline.
The non-ISO West is home to some of the fastest-growing datacenter hubs in the US, including Phoenix and Reno, Nev. Phoenix's IT capacity is set to increase 156% from year-end 2023 through year-end 2028, according to 451 Research forecasts. This would make it the third-largest US datacenter market in the next four years, jumping three places in the rankings. Of note, the planned 550-mile, 525-kV SunZia transmission project will transport wind energy produced in New Mexico all the way to the planned 500-kV Pinal Central substation in Pinal County, Ariz., just southeast of the Greater Phoenix area — an illustration of additional transmission infrastructure being developed to support the boom in renewable energy capacity in the US.

For Reno, 451 Research projections are even more bullish, with an expected IT capacity expansion of 189% in the 2023–28 interval — the largest among the current top 20 US datacenter markets. In comparison, Las Vegas's datacenter IT capacity is anticipated to grow 52% over the same period. Currently, 1,543 miles of new transmission lines are in development in Nevada, including 931 miles beginning and ending in the state itself, 327 miles with a point of origin in Utah and 285 miles starting in Idaho.
Of note, five of 451 Research's top 20 US datacenter markets by IT capacity as of year-end 2023 — Alabama; Atlanta, Ga.; North Carolina "other" (excluding Charlotte, Raleigh and Winston-Salem); South Carolina "other" (excluding Columbia); and Tulsa, Okla. — are located within the non-ISO Southeast. As of our US datacenter and energy outlook – Powering the AI economy report, three of these five markets were expected to see capacity grow from 83% to 153% from year-end 2023 through year-end 2028. But only 937 miles of new transmission lines are currently planned in the region, including nearly two-thirds to be entirely local. That said, the transmission picture could evolve relatively quickly across the region, which is increasingly prized by green energy developers and manufacturers.
Following its 2023 National Transmission Needs Study, on May 8, 2024, the US Department of Energy's Grid Deployment Office unveiled its proposal for National Interest Electric Transmission Corridors — geographies with transmission infrastructure deemed inadequate to meet demand or ensure reliability. Across National Interest Electric Transmission Corridors (NIETCs), the federal government will have greater power to override state authorities in siting decisions, facilitating the approval process. Transmission projects within NIETCs will be eligible for special Inflation Reduction Act funding dedicated to transmission siting and development.
Data visualization by Rameez Ali and Shirley Gil. Map visualization by Jonathan Paul Lalgee.
For wholesale prices and supply and demand projections, see the S&P Global Market Intelligence Power Forecast.
Regulatory Research Associates is a group within S&P Global Commodity Insights; 451 Research is part of S&P Global Market Intelligence. S&P Global Commodity Insights and S&P Global Market Intelligence are divisions of S&P Global Inc.
S&P Global Commodity Insights produces content for distribution on S&P Capital IQ Pro.
This article was published by S&P Global Market Intelligence and not by S&P Global Ratings, which is a separately managed division of S&P Global.