


BLOG — Jan 31, 2025
ChartIQ’s 2024 Product Advancements: Enhancing Accessibility, Flexibility, and Insights
Reflecting on 2024, ChartIQ has embarked on an exciting journey of enhancements, unveiling features and updates that significantly refine our platform to better support your evolving needs. From boosting accessibility to expanding charting capabilities, let's explore the key milestones that have elevated our product in 2024.
Compact Chart: Space-Efficient and Powerful
In response to the growing need for multi-platform capabilities, we introduced the Compact Chart—a sleek, space-efficient solution designed to maximize screen real estate. Whether you're using mobile devices, dashboards, or portals, the Compact Chart delivers powerful insights without cluttering your interface. It’s perfect for users who need essential financial data at a glance, all while maintaining the core functionality that ChartIQ is known for.
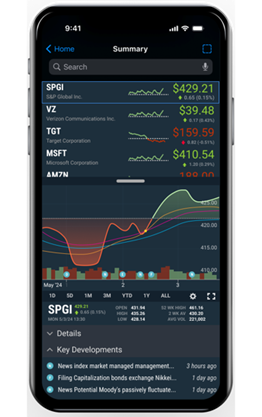
Fig 1. Compact Chart by ChartIQ. Source: S&P Global Market Intelligence, ChartIQ. Date as of 6/24/2024.
Advancing Accessibility for All Users
At ChartIQ, we are committed to an inclusive charting experience. This year, we introduced even more accessibility features to enhance usability for all users. Key updates include:
- Command Line UI: A new interface for quicker discovery and access to chart commands.
- Expanded Screen Reader Support: Ensuring a seamless experience for visually impaired users.
- Color Blindness-Friendly Themes: Offering accessible color schemes.
These updates are fully WCAG-compliant, ensuring that all users—regardless of their needs—can navigate and utilize the platform with ease.
Multi-Periodicity: Deeper Insights with Multiple Timeframes
The introduction of Multi-Periodicity Support has significantly enhanced ChartIQ’s financial analysis capabilities. This feature allows users to display data across different timeframes on the same chart, simplifying trend comparisons across multiple periods. Imagine overlaying quarterly data on a daily chart for a comprehensive market understanding—this is precisely what Multi-Periodicity allows.
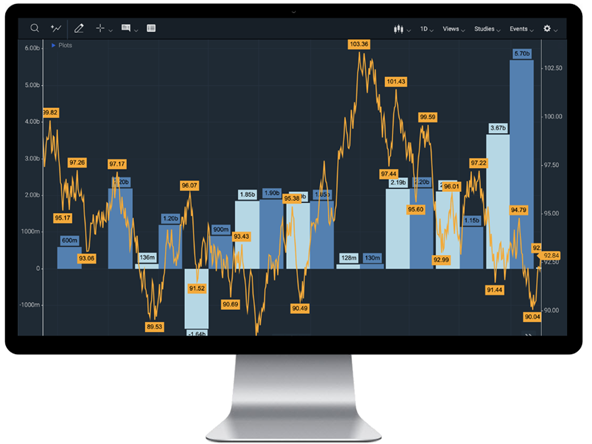
Fig 2. Low-Frequency Data Overlaid with High Frequency Data. Source: S&P Global Market Intelligence, ChartIQ. Date as of 1/29/2025.
Product Enhancement Highlights
Beyond major features, we've introduced several enhancements to improve functionality and user experience:
- Y-Axis Enhancements: Support for percent and net change displays, axis titles, and a customizable API for greater chart control.
- NPM Support: Version 9.6 introduces NPM support for frameworks like Angular, React, and Vue, ensuring seamless integration for developers without complicated customizations.
Looking Ahead to 2025: A Leap into the Future
As we approach 2025, we anticipate continued growth and innovation. Here's a preview of what's coming:
In 2025, ChartIQ will advance with expansions to the graphics library, technical analysis enhancements, and new AI use cases. Enhancements will include improved drawing tools, an overhauled chart legend, and expanded multi-chart capabilities. Quality-of-life improvements, such as manual price inputs, will also be introduced.
Graphic library expansions will feature ready-made D3 integrations, as well as enhancements to ChartIQ’s term structure charts. Accessibility initiatives will broaden keyboard navigation, enhance the command line interface, and unveil the anticipated Chart2Music feature. ChartIQ is committed to bringing all users into the future, enhancing experiences for both unimpaired and impaired users.
A Year of Innovation and Inclusivity
Reflecting on 2024, we are proud of our progress in making ChartIQ a more inclusive, flexible, and powerful platform. However, we are even more excited about what's coming in 2025. As we continue to innovate, our goal is to provide you with a diverse set of financial tools and visualizations, equipping you to make informed, impactful decisions.
Content Type