Featured Topics
Featured Products
Events
S&P Global Offerings
Featured Topics
Featured Products
Events
S&P Global Offerings
Featured Topics
Featured Products
Events
S&P Global Offerings
Featured Topics
Featured Products
Events
Financial and Market intelligence
Fundamental & Alternative Datasets
Government & Defense
Banking & Capital Markets
Economy & Finance
Energy Transition & Sustainability
Technology & Innovation
Podcasts & Newsletters
Financial and Market intelligence
Fundamental & Alternative Datasets
Government & Defense
Banking & Capital Markets
Economy & Finance
Energy Transition & Sustainability
Technology & Innovation
Podcasts & Newsletters
ECONOMICS COMMENTARY — Aug 18, 2021
The main gauge used by many analysts to estimate the current underlying growth rate of GDP in the euro area is the composite Output Index from the IHS Markit Eurozone PMI. This index is a weighted average of the manufacturing and service sector survey output indices and as such gives a representative indication of monthly changes in output across the majority of private sector economic activity.
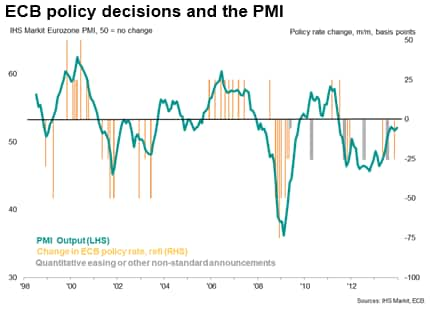
Importantly, the PMI is available many weeks ahead of comparable official GDP data, and in some cases can provide signals of turning points several months ahead of GDP data. One such example of this was in 2008, when the ECB hiked interest rates in the midst of a downturn and then failed to change course swiftly with corrective interest rate cuts, having been in part misled by GDP data that were subsequently revised.
Alarm bells started ringing in June 2008, when the flash eurozone PMI output index fell to 49.3, signalling a contraction of economic activity for the first time in five years. The PMI press release reported how the survey was "painting a darker picture of Eurozone growth prospects for the rest of the year. At the same time, the survey highlights a further surge in inflationary pressures. These inflationary pressures are forcing the ECB to raise rates and take unprecedented risks with growth in the region. Economic activity in the Eurozone in the second half of the year will likely turn out weaker than the ECB anticipate."
The ECB did indeed hike its policy rate by 25 basis points to 4.25% in early July, looking through a fall of the PMI into contraction territory to focus instead on intensifying inflationary pressures.
The ECB was basing its case to a large degree on the slowdown merely being a function of some natural cooling in growth after an especially strong start to the year. A second quarter 0.2% GDP contraction, and therefore the associated weakness of the PMI, was seen as "a technical counter-reaction to the strong quarter-on-quarter increase of 0.8% in the first quarter. As the Governing Council has stressed previously, the quarterly growth rates for the first half of this year have been subject to strong temporary and compensatory factors, notably weather-related effects on the profile of construction activity. Therefore, in order to assess the underlying momentum of euro area economic activity and to avoid being misguided by highly volatile quarterly outturns, it is necessary to evaluate the first two quarters of 2008 together. Interpreted on this basis, the information available remains broadly in line with the Governing Council's expectation of moderate ongoing growth."
However, the flash eurozone PMI output index fell further to 47.8 in July 2008. Barring the global economic slump seen in the wake of 9/11, this was the lowest reading in the survey's ten-year history. The accompanying press release noted that "Forward looking indicators, notably the accelerating rate of loss of new business and reduction in employment, paint a bleak outlook for the rest of the quarter and raise the possibility that the Eurozone will endure a technical recession, which is already evident in Spain and Italy. A cut in base rates is clearly called for by these data."
However, although the July 2008 rate hike was already starting to look like an error, the ECB's Governing Council decided to maintain its policy rate at 4.25% at its August meeting, once again noting in their press conference that "In order to assess the underlying momentum of euro area economic activity and to avoid being misguided by highly volatile quarterly outturns, it is necessary to look through the volatility in quarter-on-quarter growth rates and monthly indicators."
Policy was also held steady in September 2008, the ECB believing that "the euro area economy is currently experiencing an episode of weak activity characterised by high commodity prices weighing on consumer confidence and demand, as well as by dampened investment growth. This episode is expected to be followed by a gradual recovery". Its staff projections saw "average annual real GDP growth of between 1.1% and 1.7% in 2008, and between 0.6% and 1.8% in 2009."
These projections were soon discarded, however, as the flash Eurozone PMI fell even further - to 43.6 - in October, with the global PMI likewise falling sharply to 42.5. Both readings were by far the lowest ever recorded.
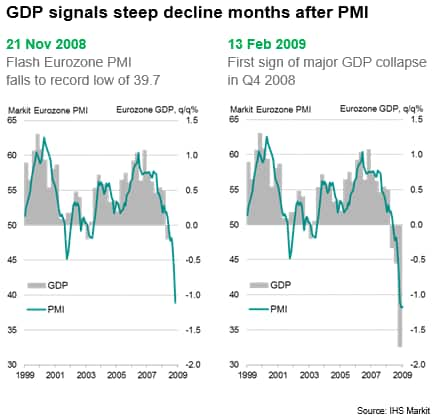
The ECB, along with the US Fed, Bank of England, Bank of Canada, Riksbank and Swiss National Bank, finally cut interest rates on 8th October in response to the deteriorating economic climate. By 21st November, the flash Eurozone PMI had sunk to 39.7.
The PMI was now signalling a steep contraction of GDP in the third quarter, and the data available up to November were foretelling of a contraction of unprecedented proportions for the eurozone in the fourth quarter.
It nevertheless still took a while for the official data to confirm the PMI's signal of economic collapse. In fact, it was not until 13th February 2009 - around three months after the release of the shocking PMI numbers - that the initial estimate of eurozone GDP for the fourth signalled an economic collapse.
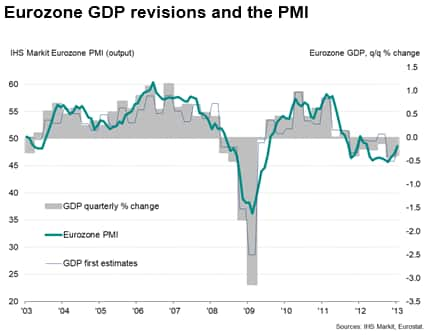
An important footnote is that the strong 0.8% GDP expansion at the start of 2008, which helped persuade the ECB that the economy was on a firm footing that year, has since been revised away in subsequent GDP updates to now only half of that expansion at just 0.4%. A further look at how the PMI can help predict GDP revisions is available here.
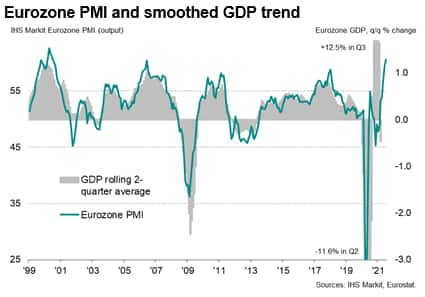
One further footnote is that the ECB's stated desire to look through the volatility of GDP data can be easily achieved simply by using the PMI. As the below chart shows, the PMI exhibits an extremely high (90%) correlation with the rolling two-quarter average of quarter-on-quarter GDP growth for the eurozone.
All through the global financial crisis, the PMI data provided an alternative and more accurate guide to the underlying trend in the economy than GDP, which could have helped policymakers see through the erratic GDP data and understand that the economy was entering a more worrying period of decline than the official data were signalling, in theory avoiding the July 2008 rate hike and instead cutting rates earlier in the downturn to prevent the recession exerting such as huge toll. In the event, GDP rose by just 0.3% that year in 2008 before plummeting 4.5% in 2009. By comparison, US GDP fell by 2.5% in 2009.
Chris Williamson, Chief Business Economist, IHS Markit
Tel: +44 207 260 2329
chris.williamson@ihsmarkit.com
© 2021, IHS Markit Inc. All rights reserved. Reproduction in whole or in part without permission is prohibited.
Purchasing Managers' Index™ (PMI™) data are compiled by IHS Markit for more than 40 economies worldwide. The monthly data are derived from surveys of senior executives at private sector companies, and are available only via subscription. The PMI dataset features a headline number, which indicates the overall health of an economy, and sub-indices, which provide insights into other key economic drivers such as GDP, inflation, exports, capacity utilization, employment and inventories. The PMI data are used by financial and corporate professionals to better understand where economies and markets are headed, and to uncover opportunities.
This article was published by S&P Global Market Intelligence and not by S&P Global Ratings, which is a separately managed division of S&P Global.


