Research — Nov 10, 2026
When AISC margins do not translate into cash flow

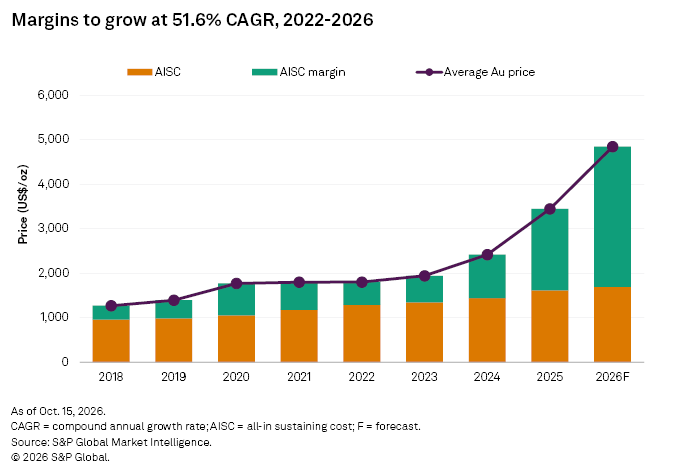
Record-high gold prices between 2022 and 2026 have given the gold mining industry comfortable margins. In 2025 alone, the average gold price reached US$3,444 per ounce, up 42.5% compared to 2024, while the average all-in sustaining costs for gold production on a coproduct basis rose 11.9% to US$1,615/oz year over year, driving margin growth to 87.9% in the same period. However, healthy margins do not promise unrestricted cash generation, as revealed by our five-year operational free cash flow (FCF) conversion framework from 2022 through 2026.

➤ In 2025, margins remained healthy, rising 87.9% compared to 2024, despite the 11.9% year-over-year growth in all-in sustaining costs to US$1,615/oz on the back of record-high gold prices.
➤ Margins are not always converted to cash, and how mines allocate their development capital expenditure impacts their cash-generating viability.
➤ Our 2022 through 2026 (forecast) operational cash flow conversion framework classifies mines into three distinct profiles: steady state, expansion and capital-intensive.

AISC and the margin boom
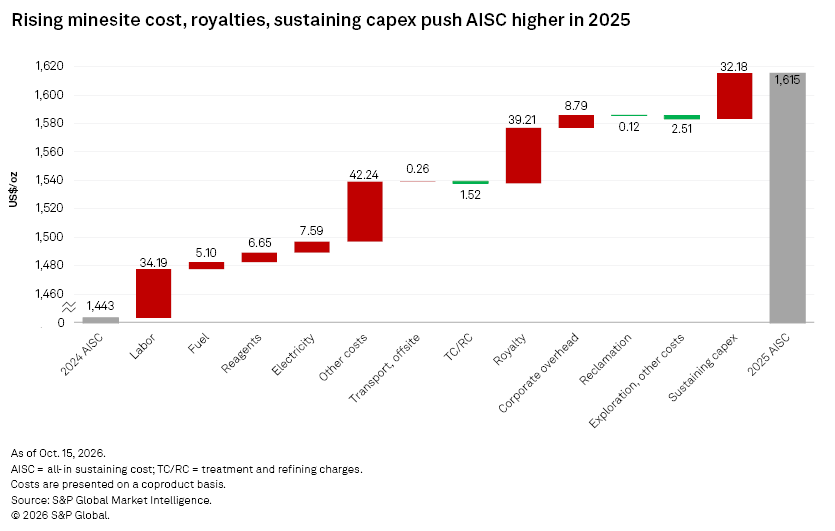
From 2023 to 2025, surging gold prices significantly expanded AISC margins, masking a persistent year-over-year increase in AISCs. Despite this, margins have remained comfortable for gold producers, rising at a compound annual growth rate of 51.6% over the period. In 2025 alone, average AISCs on a coproduct basis increased 11.9% year over year to US$1,615/oz, driven by a strengthening foreign-exchange-rate environment, domestic wage inflation, royalties and rising sustaining capital expenditure.
A key driver of the 2025 cost increase was the strengthening of local currencies in several major gold-producing countries against the US dollar, which resulted in an increase in the locally incurred operating costs when translated into US dollars. While the Chinese yuan was broadly unchanged against the US dollar, the Russian ruble and Ghanaian cedi strengthened 11% and 17%, respectively, year over year. Inflationary pressures also lifted local-currency cost bases across key producing regions. In Australia, Mexico and Brazil — where currency movements did not materially exacerbate US dollar-denominated costs — local wage rates were up 8%, 9% and 5% year over year, respectively. Together, forex movements and wage inflation increased minesite costs by 9.6% year over year, adding US$95.79/oz to the average AISC.
Because royalties and production taxes are typically calculated as a percentage of gross revenue or operating profit, the surging gold price automatically triggers higher royalty payments. As a result, royalties went up 34.9% year over year in 2025, adding US$39.21/oz to the average AISC.
Sustaining capex also grew 13.8%, adding US$32.18/oz to the average AISC. This is in line with year-over-year increased sustaining capex spending by gold producers, such as Agnico Eagle Mines Ltd. (5% to US$955 million), AngloGold Ashanti PLC (22% to US$1,141 million), Gold Fields Ltd. (21% to US$1,029 million) and Kinross Gold Corp. (15% to US$606 million).
Despite the AISC rising continuously since 2019, margins have remained remarkably healthy from 2018 to 2026, even with declines in 2021 and 2022. Driven by record-breaking gold prices, the post-2023 margin boom created an image of historic financial health across the gold mining industry.
Narrowing the gap: Operational free cash flow conversion ratio
While the sector is experiencing an unprecedented margin boom, standard AISC is not designed to measure cash retention or broader cash-generation capacity. To evaluate the financial strength of these gold mining assets, we introduce the operational free cash flow (FCF) conversion ratio. By focusing on growth capex, this framework excludes the impact from corporate income tax and working capital fluctuations, isolating how site-level AISC margins are preserved rather than consumed by capital expansion programs.
Capital expansion cycle as a cash drain
The gap between an asset's margin and its actual cash generation is driven by the capital expansion cycle. Under the S&P Global Mine Economics methodology, capital expenditure is classified as sustaining or development capital. Sustaining capex is required to maintain current production levels, while development capex supports activities such as mine-life extensions, increases in gold production and other major expansion projects. Sustaining capex is included in the AISC, while development capex may be captured in the broader all-in cost (AIC) but is excluded from the AISC. Consequently, an asset can appear highly profitable on an AISC cost curve while requiring substantial additional capital investments. In this analysis, we examine development capex separately from the AISC to measure the extent to which an asset's AISC margin is absorbed by growth projects.
Defining the operational FCF conversion ratio
The operational FCF conversion ratio measures the proportion of a mine's AISC margin that is preserved as cash rather than being reinvested as an expansion project. It is calculated by subtracting the development capex from the AISC margin, then dividing the result by the AISC margin to obtain a percentage. In this framework, a conversion rate of 100% indicates that a mine has no growth capital requirements and is converting its margin into cash. Conversely, a lower percentage indicates that a company has chosen to reinvest in the asset for long-term production growth.
Methodological framework: The 5-year aggregate cycle
To eliminate distortion from elevated single-year capital spend and capture a full economic cycle, we evaluate assets over a continuous five-year period, from 2022 to 2026. Historical data is used for 2022-2025, while 2026 figures are forecast. We apply the aggregate dollar method by summing the absolute dollar values of margins and development capex over these five years, then perform the conversion division. Assets that were not active and in commercial production for the entire five-year cycle are excluded from the peer group comparison to prevent newly commissioned mines or closed operations from distorting the benchmarks.
Comparing gold mining assets — archetype deconstruction
To demonstrate the gap between a mine's standard AISC and its long-term cash-generation ability, we evaluate a global peer group over a full five-year cycle from 2022 through 2026. Comparing these assets reveals the disconnect between AISC margins and cash retention and categorizes assets into three distinct profiles.
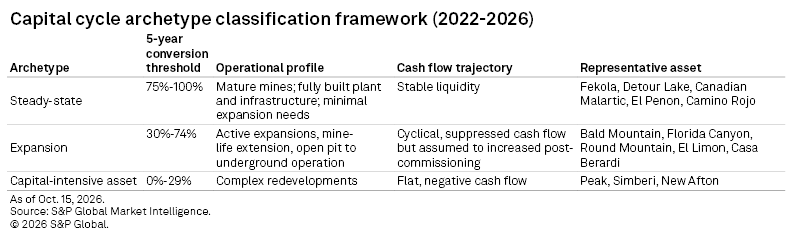
Profile 1: Steady state (more than 75% conversion ratio)
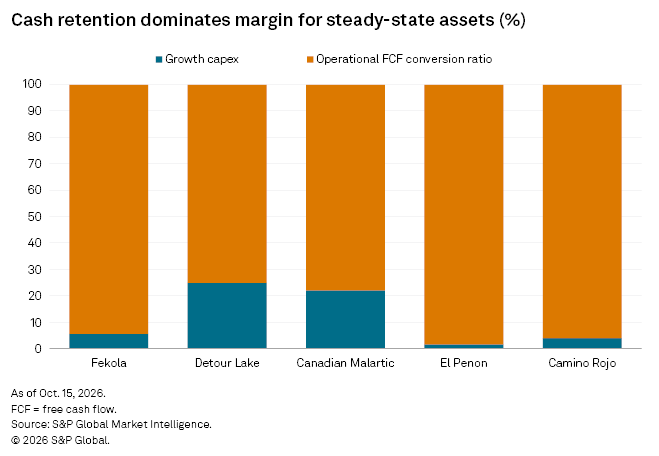
The steady-state assets in our peer group operate in a pure-harvest state, consistently prioritizing cash retention over expansion. B2Gold Corp.'s Fekola mine in Mali and Agnico Eagle's Detour Lake and Canadian Malartic mines in Canada mostly sit in the second quartile of the global cost curve from 2022 through 2026. These mines have required continuous development capex over this period, incurring cumulative growth spending of US$191 million, US$1.39 billion and US$1.01 billion, respectively. Yet, these cash outflows consumed only 5%, 25% and 22% of their five-year cumulative AISC margin. Consequently, these assets achieved remarkable operational FCF conversion ratios of 95%, 75% and 78%, respectively, demonstrating their cash-generation ability over a full market cycle.
This cash-harvesting capability is further highlighted by the contrasting profiles of Pan American Silver Corp.'s El Peñon mine in Chile and Equinox Gold Corp.'s Camino Rojo. Despite sitting in the fourth quartile of the 2022-26 global cost curve, it has successfully taken advantage of a high-price environment by minimizing the development capex and converting 98% of its margin to cash.
From 2022 to 2026, El Peñon is estimated to spend US$12.39 million in development capex, equivalent to just 2% of its five-year cumulative AISC margin. Conversely, Camino Rojo sits comfortably in the first quartile of the global cost curve, converting 98% of its five-year cumulative margin of US$1.129 billion into cash, with similarly minimal development capex.
While both mines demonstrate excellent cash conversion over the five-year cycle, it is critical to note that they are mature mines with estimated remaining mine lives of four and five years, respectively. This suggests that their operational FCF conversion ratios reflect a deliberate winding down of reinvestments rather than an extension of operations.
Profile 2: Expansion (30%-74% conversion)
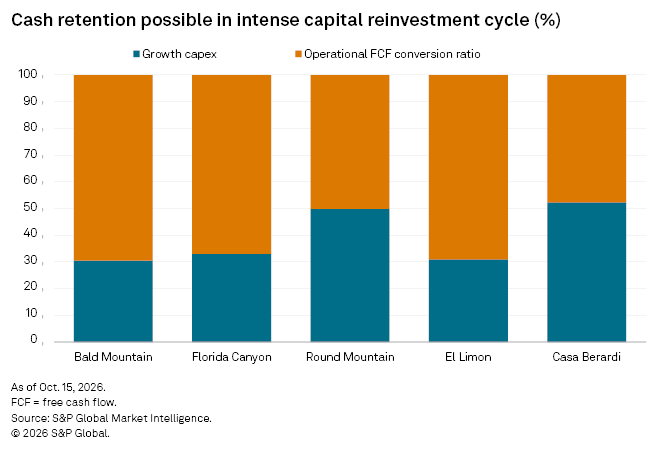
In contrast to steady-state assets, expansion assets are operations actively undergoing an intensive capital reinvestment cycle. These are typically strategic orebodies with strong potential to extend mine life, convert resources to mineral reserves and optimize plant recovery. In these cases, management has made a strategic decision to allocate a substantial portion of the margins toward long-term operations by developing new satellite pits, transitioning from open-pit to underground operations or upgrading processing facilities.
Kinross Gold's Bald Mountain in the US and Equinox Gold Corp.'s El Limón in Nicaragua mostly sit in the second quartile of the 2022-26 global cost curve, generating healthy five-year cumulative margins. Despite substantial capital headwinds, Bald Mountain effectively preserved 70% of its five-year cumulative margin of US$1.138 billion — and El Limón preserved 69% of its five-year cumulative margin of US$450 million — as cash. From 2022 to 2025, Kinross Gold was focused on extending Bald Mountain's mine life by increasing mineral reserves and on mining from additional pits, starting with the development of the Vantage Complex, which led to a larger-scale project at Redbird. Extending the mine life of El Limón had been a shared focus for Equinox Gold and Calibre Mining Corp. — before Equinox's acquisition — through aggressive exploration, phased pit development and high-grade underground expansion.
Most notably, the five-year average framework reveals that even high-cost assets can demonstrate impressive cash resilience during capital cycles. Integra Resources Corp.'s Florida Canyon and Kinross Gold's Round Mountain in the US and Orezone Gold Corp.'s Casa Berardi in Canada all sit at the fourth quartile of the global cost curve from 2022 to 2026. Yet, they successfully converted 67%, 50% and 48%, respectively, of their five-year cumulative margins of US$58 million, US$715 million and US$287 million into cash. This proves that an asset can undergo an intense capital-spending program while still maintaining its cash-generating ability. Furthermore, while some assets recorded negative margins for one or two years during the cycle, their positive five-year operational FCF demonstrates that temporary capital-intensive phases should not be used to dismiss an asset's long-term cash-generating capacity.
Profile 3: Capital-intensive (less than 30% conversion)
Unlike the steady-state and expansion assets, capital-intensive assets require sustained investment to maintain, extend or expand operations. When higher site-level costs are coupled with significant ongoing capital requirements, development capital can absorb a substantial portion of the asset's margin, limiting cash retention. Within our framework, these are assets with a five-year aggregate operational FCF conversion ratio of less than 30%, with some recording negative ratios during periods of elevated capex.
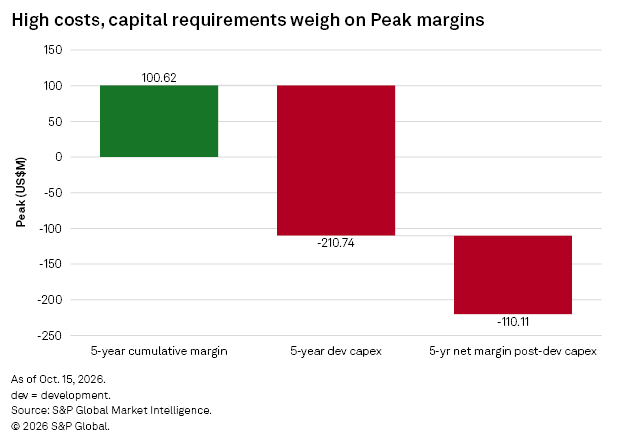
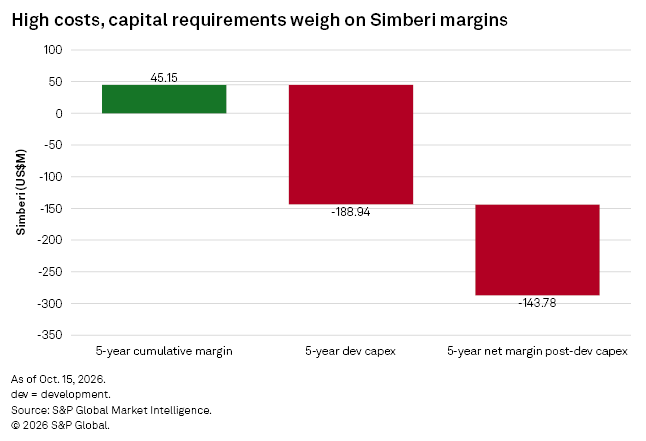
Aurelia Metals Ltd.'s Peak in Australia and St Barbara Ltd.'s New Simberi in Papua New Guinea are examples of this profile, generally ranking in the fourth quartile of the 2022-26 global cost curve. As a result, they generate positive margins primarily under the elevated gold price environment observed after 2023. Despite these elevated prices, both mines are expected to record negative operational FCF over the five years due to continued capital reinvestment, indicating that their margins have been substantially absorbed by capital requirements.
At the Peak mine, Aurelia Metals invested in optimization projects to maximize output at current throughput rates and achieve higher recoveries, following operational challenges reported by the company. The Great Cobar Project was approved in April 2025, with construction beginning in July 2025 and completion expected in 2028. We therefore estimate that Aurelia Metals will continue to allocate development capital to Peak through 2028, keeping the asset's estimated operational FCF negative in the near term before the project's potential benefits are realized.
Similarly, the Simberi operation is undergoing a capital-intensive transition, as the mine depletes its oxide ore reserve and the company advances the Sulfide Expansion Project. While this development capital is necessary to process sulfide ore, extend mine life and increase production, it is expected to absorb a substantial portion of the mine's estimated margin during the development phase.
In contrast to these high-cost, high-capital assets, Coeur Mining Inc.'s New Afton mine in Canada sits in the second or third quartile of the 2022-26 global cost curve. However, spending on its C-Zone development project began to taper off starting in 2026, allowing the mine to generate positive operational FCF only in 2026, offsetting the cumulative negative operational FCF from 2022 to 2025. This highlights that while assets may sit in seemingly acceptable positions on the AISC cost curve, they can remain cash flow negative over the long term.
Consequently, New Afton's five-year operational FCF conversion ratio of 16% masks a substantial positive turnaround in 2026. We forecast that New Afton will likely transition from capital trap to expansion following the commissioning of its C-Zone project, which is aiming to reach 16,000 metric tons/day in late 2026. As the development capital allocation for the C-Zone project tapers off, we project that operational FCF will move into positive territory, resulting in a rising operational FCF conversion ratio if Coeur Mining shifts from the investment phase to the harvest phase.
Why look beyond profitability?
The widening divergence between site-level AISC margins and post-development-capex cash flow over the 2022-26 cycle demonstrates that standard cost curves provide an incomplete picture of a gold asset's financial health. While the post-2023 surge in gold prices created the appearance of broad-based sector profitability, our five-year operational FCF conversion framework demonstrates that on paper, profitability does not guarantee positive cash flow after development spending. Development capital requirements affect a mine's ability to retain cash and may either support long-term growth or create sustained cash flow pressure.
This article was published by S&P Global Market Intelligence and not by S&P Global Ratings, which is a separately managed division of S&P Global.