Research — Sep 03, 2026
Life insurance premium growth fuels Q2 gains for US life insurers
By Tim Zawacki, Jason Woleben, and Husain Rupawala
Second-quarter growth in US individual and group life premiums pushed US life industry premiums and considerations higher on a year-over-year basis, offsetting lackluster trends in other lines.

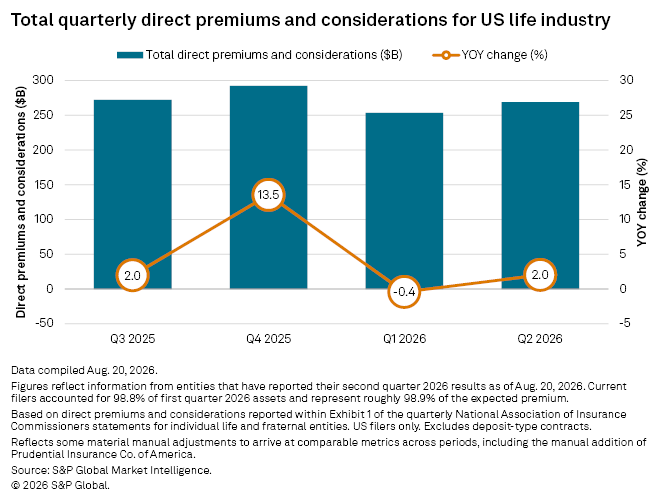
Sector-wide direct premiums and considerations of $268.92 billion in the second quarter represented a 2.0% increase from the year-earlier period as the sector bounced back from a modest retreat in the first quarter. These results reflect the aggregation of statutory data for more than 660 individual life entities and include certain material adjustments. Please see the methodology section for a detailed explanation of adjustments and limitations.
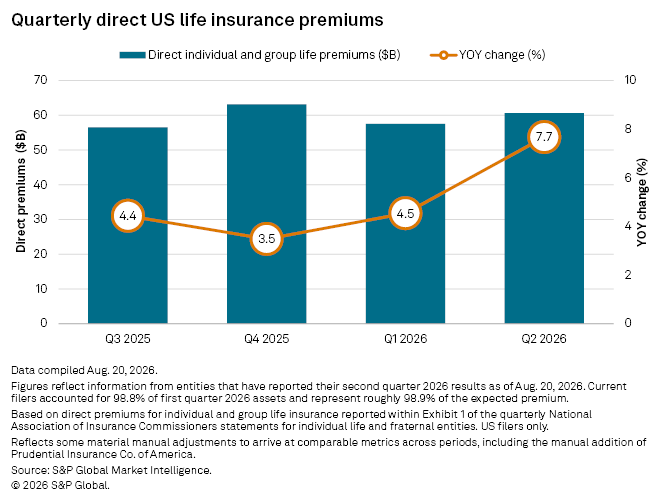
Life insurance premium growth was a notable strength for the industry during the second quarter. Group life premiums surged 20.9% to $14.56 billion, with at least one company benefiting from a single large bank-owned or corporate-owned life insurance transaction. Individual life volume was $46.05 billion, an increase of 4.1%. On a combined basis, life premiums increased by 7.7%, matching the industry's largest expansion since the second quarter of 2025.
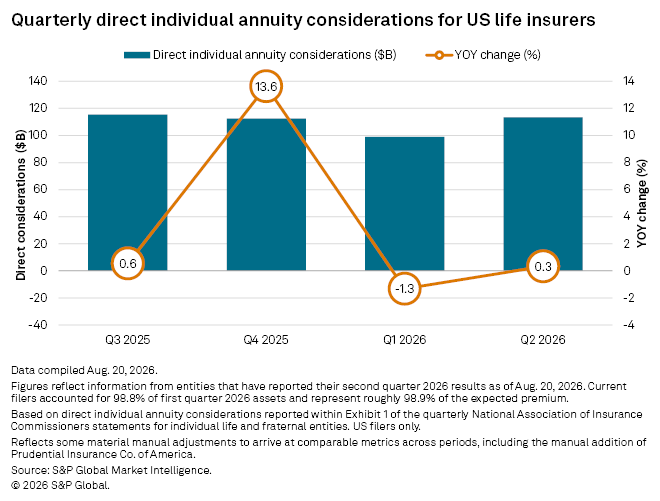
Trends in individual annuity considerations were mixed among the largest market participants and among methods of measurement. Several companies recorded either double-digit year-over-year increases or declines in statutory data as overall individual annuity considerations slightly ticked higher, rising 0.3% to $113.44 billion. This contrasts with the headline from LIMRA's quarterly sales survey, which heralded growth in overall individual sales of 4% to a new quarterly record of $123.9 billion, fueled by expansion in both traditional variable annuities and registered index-linked annuities (RILAs).
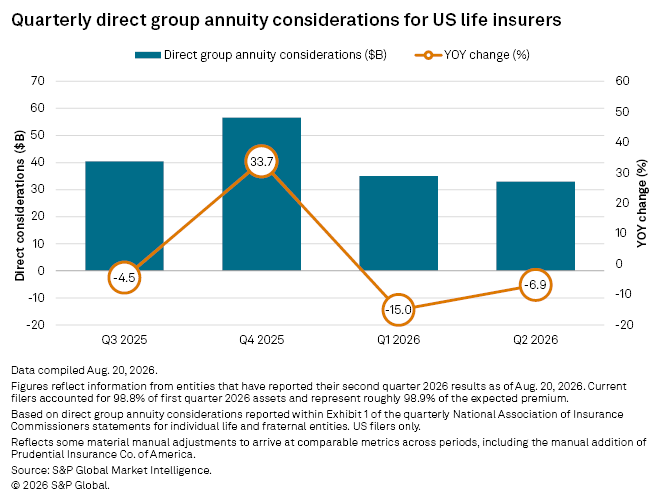
A lack of jumbo pension risk transfer business in 2026 continued to hamper group annuity considerations, with the business line considerations falling to $32.95 billion, a decline of 6.9%.

Group life insurance direct premiums grew 20.9% year over year for US life insurers during the second quarter, the largest increase among any reported business line. The rise was mainly driven by outsized growth reported by Nationwide Life Insurance Co., The Prudential Insurance Company of America, and Corebridge Financial Inc.'s American General Life Insurance Co.
Each insurer has a sizable footprint in bank-owned life insurance (BOLI) and corporate-owned life insurance (COLI), which can contribute to the uneven year-to-year growth rate within the group life business line. Although, depending on the structure of the contract, policy premiums may appear on either the group or individual reported business line with the statutory statements. Excluding these three insurers, we estimate a much more modest group life growth rate of 1.5% during the second quarter of 2026.
Individual life premiums continued to grow at a more moderate rate of 4.1% during the most recent quarter. Among the largest writers during the quarter, a few stand out with substantial increases. The group led by Protective Life Insurance Co. reported its individual life premiums surged to $1.41 billion in the second quarter of 2026, compared to $967.4 million during the prior-year period. Lincoln National Corp.'s individual life premiums grew by 23.7% to $1.99 billion in the most recent quarter.
Lincoln CEO Ellen Cooper said that total life sales were up 80% year-over-year, driven by MoneyGuard, its combination life and long-term care product, and variable universal life with limited guarantees product. She also noted that its executive benefits, covering its BOLI or COLI policies, rose due to a single large case. The insurer reported $113 million in executive benefits sales compared to only $34 million during the second quarter of 2025.
Combined life and group life premiums jumped 7.7% to $60.61 billion in second quarter of 2026.
The statutory data, unlike the LIMRA sales survey, indicates that the industry fell short of a record tally in the individual annuity business.
While the survey results do not replicate statutory direct considerations, they do provide individual product trends that are not reported within the quarterly statutory data. The aggregation of statutory data suggests that individual annuity considerations increased at less than half the rate shown in the survey. The total sales number was $10.46 billion above the statutory direct considerations, in line with the divergence in the first quarter but well ahead of the average quarterly gap of $5.77 billion in 2025.
Sales of fixed annuity products are no longer driving the growth, according to the LIMRA survey. Year-over-year fixed annuity sales declined 3.6% during the second quarter versus 23.4% growth rate for total variable annuity sales. For the first six months of 2026, fixed annuity sales are down 5.2% while variable annuity sales are up 21.0%.
RILAs have been a significant driver of the growth in variable annuity sales in recent years; however, the growth rate for traditional variable annuity sales surpassed RILA sales in the second quarter. This marks the first time that traditional variable annuity sales grew at a faster pace than RILA sales in a quarter since LIMRA began separating the product sales figures. The separation of the two variable annuity sales can be traced back to the first quarter of 2019.
The survey results report traditional variable annuity sales grew by 25.2% to $17.9 billion, while RILA product sales rose 22.0% to $23.3 billion. Overall, LIMRA's second-quarter individual annuity sales survey reflects a 3.9% year-over-year increase.
It was something of a tale of two trends as several of the 10 largest writers of individual annuities in 2025 saw substantial increases, while several companies had sizable decreases during the quarter
The US subsidiaries of Athene Holding Ltd. remained the largest writer of individual annuities during the quarter, with $12.35 billion in individual annuity considerations during the quarter, compared to $7.44 during the previous year. Its increase was primarily driven by its fixed annuity (multiyear guaranteed annuity) and what the company described as "record volumes" of RILA inflows. The insurer noted the increase was partially offset by a decline in fixed index annuity (FIA) sales.
Jackson Financial Inc., the leader in traditional variable annuity sales, reported individual annuity considerations of $7.14 billion during the second quarter of 2026, up 49.3% year-over-year. The company credited substantially higher retail sales to RILA and FIA sales for substantial growth.
Other companies with double-digit increases were New York Life Insurance Co., Equitable Holdings Inc. and Nationwide. New York Life cited higher sales of participating income annuities within its Retail Annuities segment.
On the other hand, the group led by Massachusetts Mutual Life Insurance Co., Corebridge and Pacific Mutual Holding Co. had sizable year-over-year decreases of 54.3%, 34.7% and 10.2%, respectively. MassMutual attributed its retreat to lower premium income in fixed and income annuities.
In the group annuity business, double-digit declines were commonplace among leading writers. This includes a 45.3% decrease at Nationwide, 34.6% at MassMutual, 20.8% for Prudential Financial Inc., 20.0% at Lincoln and roughly 10.0% for Transamerica Life Insurance Co. and Teachers Insurance & Annuity Association of America (TIAA). MassMutual cited declines in pension risk transfer (PRT), stable value investments and workplace pension business.
PRT activity was soft during the quarter with a notable absence of jumbo transactions in the US during the first half of the year, according to Prudential CEO Andrew Sullivan's second-quarter remarks during the firm's earnings call.
While activity typically accelerates during the second half of the year, Sullivan stated that he expects sales to remain below recent years' record levels. He further noted that the PRT market "represents a significant forward opportunity" despite the uneven sales volume across reporting periods.
US life insurers reported total group annuity considerations for $32.95 billion for the three-month period ending on June 30, 2026, a decline of 6.9% from the previous year.
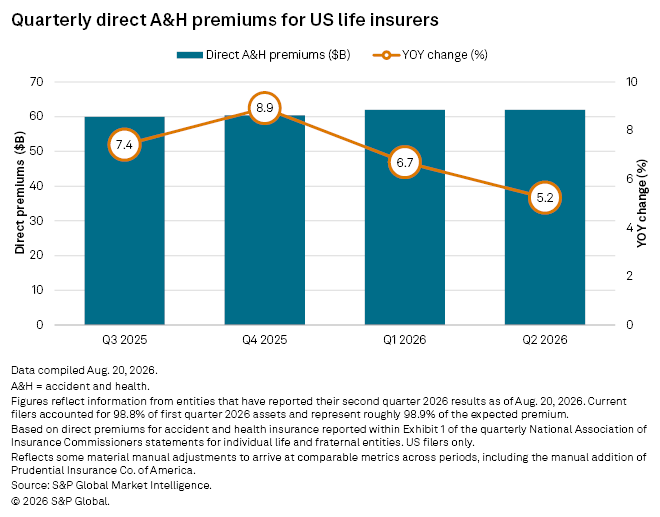
Year-over-year growth within the accident-and-health business line continued to decline for the third consecutive quarter, with the US life reporting a growth rate of 5.2% during the second quarter. The life insurance units of UnitedHealth Group Inc. and CVS Health Corp., which account for slightly over half of the accident-and-health direct premiums produced by life filers, posted expansion of 2.6% and 5.8%, respectively.
Methodology
Results from statutory filings reflect currently available data on Exhibit 1 of quarterly statements obtained by S&P Global Market Intelligence as of Aug 20, supplemented by various adjustments stemming from data that was either unavailable or incorrect. The most significant adjustments are as follows:
1) We manually added data for The Prudential Insurance Co. of America. Quarterly statutory filings and related data for New Jersey-domiciled companies, such as the Prudential subsidiary, are not disseminated by regulators for public review by state statute. Prudential posts select statutory results on its investor relations website, which we incorporated where available.
2) We manually added AmFirst Insurance Co.'s prior-year annuity considerations, as the insurer began filing life statutory statements (rather than health) to reflect rapid growth in fronted MYGA and FIA business. AmFirst reported $2.62 billion in direct individual annuity business during the first six months of 2026, up from $671.3 million in the year-earlier period. Direct annuity considerations were $1.55 billion in the second quarter of 2026.
Please note that insurers that have yet to file their most recent quarterly statements reported roughly $1.42 billion in total direct premiums and considerations during the second quarter of 2025, reflecting roughly 1.0% of the industry's total during that time. Due to the adjustments and estimates described above, values and year-over-year percentage changes calculated using S&P Global Market Intelligence industry aggregates for all periods referenced in this article will materially differ.
This article was published by S&P Global Market Intelligence and not by S&P Global Ratings, which is a separately managed division of S&P Global.
Content Type
Theme
Products & Offerings
Segment
Language