BLOG — Aug 25, 2026
Looking Ahead, Not Back: Using Implied Correlations to Stress Test and Diversify AI Concentration Risk

As of mid-2026, the dominant theme in equity risk management is the growing concentration of AI-linked mega-cap stocks within the U.S. equity market, particularly inside the S&P 500. Benchmark-constrained capital is increasingly funnelled into a small group of companies whose performance is driven by similar underlying factors. This creates a structural concentration risk across equity portfolios, passive investment products, and derivative books, forcing institutional investors with strict tracking-error mandates to absorb this exposure virtually by default. Consequently, a significant share of market returns, volatility, and capital flows can now be traced to seven highly correlated assets: the Magnificent Seven, or “Mag-7”.
Apple, Microsoft, Alphabet, Amazon, Meta, Nvidia, and Tesla exert a disproportionate influence on index performance due to their substantial combined weight. Their strong co-movement reflects a common set of underlying drivers, including AI-related capital expenditure, demand for data-centre infrastructure, and broader macroeconomic conditions. As a result, they increasingly behave as a single risk factor rather than as seven independent sources of return. Because diversification ultimately depends on holding assets with distinct return drivers and low correlations, a portfolio benchmarked to a broad index is less diversified than it appears. Instead, it represents a concentrated exposure to the continued success of the AI investment cycle.
This concentration becomes a vulnerability when the underlying valuations come under pressure, with the much-discussed AI bubble as a trigger. Equity market bubbles typically arise when market prices become disconnected from realistic expectations of future earnings. In recent years, this gap has widened disproportionately for companies most closely associated with the AI theme. Should expected payoffs be delayed or fail to justify prevailing valuations, a sharp repricing could follow, with the resulting shock propagating throughout benchmarked portfolios. Fortunately, risk managers are not left to face the consequences unprepared. The potential fallout from an AI-driven market correction can be quantified, and assessing such impacts is precisely the purpose of scenario-based stress testing.
Shock Propagation Through Sensitivities
Under a linear approximation, an asset's stressed return depends on the magnitude of the shock and the asset’s sensitivity to the Mag-7 composite. This sensitivity is governed by correlation and scaled by relative volatility, causing the same initial shock to propagate unevenly across the investment universe. Assets with stronger linkages to the Mag-7 and higher volatility will experience disproportionately larger drawdowns, while less connected assets may be comparatively insulated. This framework enables risk managers not only to identify hidden dependencies within a portfolio but also to design targeted diversification strategies that reduce concentration risk while preserving the portfolio's volatility profile and investment characteristics relative to the benchmark.
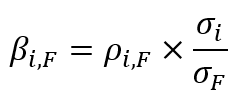
At the core of any shock-propagation framework lies the correlation matrix, which captures the expected co-movement between each asset and the Mag-7 composite. Constructing this matrix is arguably the most challenging aspect of the entire exercise.

Figure 1: Concept of a correlation matrix with the Mag-7 composite at its core. Correlations between individual assets and the basket can be computed easily and consistently.
Conventionally, correlations are estimated from historical return data, which is readily available for virtually every security, index, and risk factor. Yet historical correlation is, by definition, a backward-looking measure. It reflects realized co-movement between assets and contains no information about how market participants expect those relationships to evolve in the future.
From a practical perspective, there are two interrelated problems associated with historical correlation. The first is calibration. Historical correlation estimates are highly sensitive to methodological choices, including the lookback horizon, return frequency, and weighting scheme, yet there is no evident basis for selecting one specification over another. As a result, materially different correlation matrices can be obtained from the same underlying assets.
The deeper structural issue is that equity markets are driven by continuously evolving earnings expectations and investor sentiment rather than stable economic relationships. Historical correlations, regardless of how carefully they are estimated, can therefore only describe the dependency structure that prevailed in the past, not the one that is likely to govern market behavior going forward.
An alternative approach is to infer correlation from options market prices. Because investors trade structured products with embedded two-stock baskets for tailored payoffs and downside protection, their prices incorporate future risk expectations. At the same time, active trading in single-stock options generates market-implied volatilities for the basket components. By combining the basket option price with individual implied volatilities, the market-implied correlation between the assets can be extracted. Accounting for the implied volatilities of the underlying stocks, the basket option's price reveals the level of correlation consistent with observed market prices. The resulting measure is forward-looking, reflecting the market's view of how these stocks are likely to move together over a specific horizon.
This forward-looking signal, however, is not available for every security. Deep and liquid options markets exist primarily for large-cap stocks, whereas small-cap names, emerging-market equities, and thinly traded sectors often lack sufficient liquidity to produce reliable implied-correlation estimates. Ironically, these less liquid assets are frequently the most attractive candidates for diversifying away from mega-cap concentration risk.
This lack of implied-correlation coverage can be addressed through a Bayesian matrix-completion framework. The process begins by using historical correlations to define a prior probability distribution over admissible correlation matrices, representing the most likely dependency structure in the absence of direct market observations. Wherever liquid options markets exist, reliable implied-correlation estimates are incorporated as market-consistent constraints. For example, S&P Global Market Intelligence’s OTC-Derivatives Data (OTC-DD) extracts these implied correlations for thousands of individual equity pairs by combining vanilla-option data with the sell-side Totem Call-versus-Call (CvC) consensus service. By synthesizing these sparse market-implied constraints with historical priors, the framework yields a completed matrix that represents the most mathematically consistent and probable correlation structure.
A crucial requirement of this framework is that the reconstructed matrix remains positive semi-definite (PSD), ensuring a mathematically valid covariance structure that can be safely used for shock propagation, portfolio risk measurement, and scenario analysis. This is achieved using the Alternating Direction Method of Multipliers (ADMM), an optimization technique that efficiently reconciles historical priors with sparse market-implied observations while strictly enforcing PSD constraints. The final estimate, therefore, remains complete across the investment universe, extending market-implied information beyond the subset of securities with liquid options markets, while preserving a coherent and robust correlation structure.

Figure 2: Bayesian completion of a sparse correlation matrix. Note how the initial priors are substantially revised by the algorithm when conditioned on forward-looking market data.
With the correlation matrix complete, the shocks can be propagated across the entire portfolio rather than restricted to the handful of highly liquid securities with direct market signals. The missing correlations are inferred through the Bayesian completion process, ensuring that every holding is assigned a defensible relationship to the Mag-7 shock. As a result, shock transmission is modelled consistently across the full investment universe, enabling risk managers to quantify and manage what was previously an implicit and largely involuntary concentration risk.
The completed correlation matrix not only enables shocks to be propagated across the full portfolio but also allows stress scenarios to incorporate alternative correlation structures. This is particularly important because correlations, like volatilities, are not constant and can shift materially under adverse market conditions.
Just as implied volatilities exhibit a volatility smile, implied correlations display a correlation skew. Market-implied correlations are therefore not fixed quantities but vary across strike levels, reflecting different market expectations under different states of the world. Option markets consistently imply higher correlations at lower strike levels, indicating that expected co-movement between assets increases as market stress intensifies. In other words, markets anticipate diversification benefits to diminish precisely when they are needed most.

Figure 3: Graphical representation of the correlation skew and selected empirical correlation estimates derived from S&P Market Intelligence OTC-DD and Totem data as of 30 June 2026.
The correlation skew introduces an additional dimension along which stress scenarios can be specified, allowing risk managers to vary not only the magnitude of the shock but also the correlation regime through which it propagates. This extends the stress-testing framework beyond traditional at-the-money (ATM) correlations by enabling shocks to be propagated through out-of-the-money (OTM) correlation structures that reflect more severe market conditions.
Recognizing this uncertainty in the dependency structure is critical for scenario design. Relying on a single, average correlation estimate inevitably obscures the range of outcomes implied by the market. Instead, we recommend propagating shocks through two distinct correlation matrices: an ATM matrix representing current market conditions, and an OTM matrix representing a stressed correlation regime. The resulting range of portfolio outcomes provides a more realistic assessment of potential drawdowns than any single-point estimate.
The challenge is that correlation data becomes increasingly sparse as strikes move deeper into OTM territory. While ATM-implied correlations are observable across a relatively broad set of assets, the availability of liquid OTM option markets declines rapidly at lower strikes. As a result, constructing a comprehensive stressed correlation matrix requires progressively greater reliance on the Bayesian completion framework to bridge these widening gaps.
Case Study: Stress Testing and Diversifying AI Concentration Risk
Having established the methodology, we can now assess how a concentrated U.S. equity portfolio may respond to a severe correction in the AI theme. Our objective is twofold: to evaluate how concentration risk originating in the Mag-7 propagates through a broader portfolio, and to explore how that risk can be reduced without materially altering the portfolio's investment profile.
To focus the analysis on concentration effects, we construct a portfolio comprising 32 U.S. large-cap stocks representing approximately 50% of the S&P 500's market capitalization. The original weights of the Mag-7 constituents are preserved, while the remaining holdings are proportionally scaled to create a fully invested portfolio. This structure allows the stock composite to remain highly exposed to the dominant drivers of recent market performance while retaining meaningful diversification across sectors and individual securities.
The natural historical precedent for calibrating a shock to a concentrated technology portfolio is the bursting of the dot-com bubble in early 2000, when the leading technology names experienced a sharp initial sell-off. Between 24 March and 14 April 2000, Microsoft declined by around 40%, with similar drawdowns observed across Cisco, Intel, and Lucent Technologies. The value-weighted basket of the seven dominant technology stocks of that era lost 26.3% over the same period, providing a natural analogue to today's Mag-7 concentration. Applied to a value-weighted Mag-7 composite, this decline serves as the shock that is propagated through the remainder of the analysis.
The portfolio is evaluated using market-implied volatilities and correlations as of 30 June 2026. These inputs determine each stock's sensitivity to the Mag-7 composite and therefore govern how the scenario propagates through the portfolio. While ATM-implied correlations provide a natural baseline and remain a plausible representation of market dependencies, a drawdown of the magnitude considered here is more likely to unfold under a stressed correlation regime. Consequently, this analysis focuses on OTM-implied correlations with a relative strike of 80, allowing the model to reflect the dependency structure implied by option markets during severe downside conditions.
With both the shock magnitude and the corresponding sensitivity structure established, the concentration stress can be propagated throughout the portfolio. The resulting losses reveal not only the direct impact on the Mag-7 holdings themselves, but also the extent to which concentration risk is transmitted to other stocks through the correlation network embedded in option markets.

Figure 4: Portfolio overview with sensitivities estimated using ATM and OTM-80 correlations as of 30 June 2026. Projected drawdowns for individual holdings are derived by propagating a −26.3% shock to the Mag-7 composite through the OTM-80 correlation structure.
To contrast the results with the conventional approach, we also ran the same scenario using historical correlation and sensitivity estimates. The required data cannot be derived directly from the original 2000 technology bubble, as companies such as Meta, Tesla, Salesforce, and Palo Alto Networks were not yet publicly listed. Instead, we calibrated the model using correlation estimates from the COVID-19 market sell-off, based on daily returns observed between 20 February and 12 March 2020, a period during which the Mag-7 composite experienced a drawdown of 26.3%. This window was selected deliberately, as the magnitude of the observed drawdown closely matches the shock applied in our scenario, allowing for a more consistent comparison between the historical and implied-correlation approaches.

Figure 5: Comparison of portfolio and sector-level scenario results using historical and option-implied correlation data.
The results illustrate how strongly scenario outcomes depend on the assumed dependency structure. Correlations calibrated from the COVID-19 sell-off yield a markedly different pattern of shock transmission than those currently embedded in options markets, reflecting the sector-specific dynamics of the pandemic rather than the risks associated with today's AI-driven concentration theme.
The OTM-80 implied correlations predict larger losses than the historical correlation matrix, particularly in non-tech sectors where stronger shock transmission leads to more pronounced drawdowns. This reflects the forward-looking nature of implied correlations, which continuously incorporate market expectations and therefore adapt more readily to changing risk regimes than historical estimates. As a result, stress scenarios remain better aligned with current market conditions and provide a more robust framework for assessing concentration risk.
Perhaps the greatest advantage of implied sensitivities is their ability to support diversification strategies. To assess potential risk mitigation measures, we identify positions whose implied sensitivities are similar to those of the five holdings contributing most to the portfolio's overall concentration risk. We then reallocate a portion of these positions—25% in this example—into stocks with similar risk characteristics but lower portfolio weights. The resulting portfolio maintains significant exposure to the AI investment theme, but with a broader mix of technology-related businesses. This approach preserves the intended investment thesis while reducing concentration risk by spreading exposures across related, but less dominant, segments and individual holdings.

Figure 6: Illustrative portfolio reallocation strategy for reducing concentration risk in an equity portfolio: the five largest positions are each reduced by 25%, with capital reallocated to stocks exhibiting comparable risk characteristics under the expected scenario.
The weight reallocations shown in the table above illustrate one possible implementation of the diversification strategy. In practice, the replacement positions need not come from the existing holdings and can be selected from the broader investment universe. What matters is that the portfolio retains broadly the same sensitivity to the anticipated stress scenario, as dictated by the OTM-80 correlation and volatility skew.
By reducing the combined weight of the five largest positions from 27.9% to 20.9%, we achieved a meaningful reduction in concentration risk while preserving the portfolio's overall investment and risk profile. The allocated risk contribution estimates produced by the x-sigma-rho framework indicate that, with only five targeted trades, more than 8% of total portfolio risk can be reallocated from highly concentrated positions to other holdings. This demonstrates how concentration risks can be reduced through modest adjustments without compromising investment objectives.
Conclusion
In today's concentrated equity markets, robust stress testing is no longer optional. Risk managers need frameworks that quantify how thematic shocks propagate, reveal hidden vulnerabilities, and support targeted diversification. By embedding real-time market expectations directly into the stress-testing process, this methodology allows risk managers to evaluate concentration risks dynamically. It empowers them to map shock transmission accurately and execute diversification strategies that protect the portfolio without materially altering its core investment objectives.
While our case study focuses on a single theme, a single equity market, and a single asset class, real-world stress-testing exercises are typically far more complex. Risk managers must often analyze scenarios spanning multiple geographies, currencies, asset classes, and risk factors simultaneously. Fortunately, the rapid expansion of market-data coverage, alternative data sources, and computational capabilities has made such analyses increasingly feasible, so that large-scale scenarios can be implemented with a level of granularity that would have been difficult to achieve only a few years ago.
From an implementation perspective, however, the underlying workflow remains remarkably simple. It consists of four steps:
- Define the scenario narrative, including relevant risk factors and shock magnitudes.
- Load the appropriate variance-covariance structure.
- Propagate the shock through the portfolio based on the resulting sensitivities.
- Re-price the holdings.
Everything else is ultimately a refinement of these four building blocks. Recognizing the growing importance of forward-looking risk measurement, S&P Global has developed this methodology and made it available to clients through its Buy-Side Risk Solution. By combining market-implied data, correlation skew, and Bayesian completion techniques, the solution enables investors to quantify risks that often remain hidden in conventional historical approaches.
Why not put the framework to the test and assess your own portfolios? Explore whether hidden concentration risks are larger than they appear and identify where those risks can be reduced without compromising investment objectives.
Content Type