ECONOMICS COMMENTARY — 21 Aug, 2026
Global trade buoyed by surge in tech equipment shipments

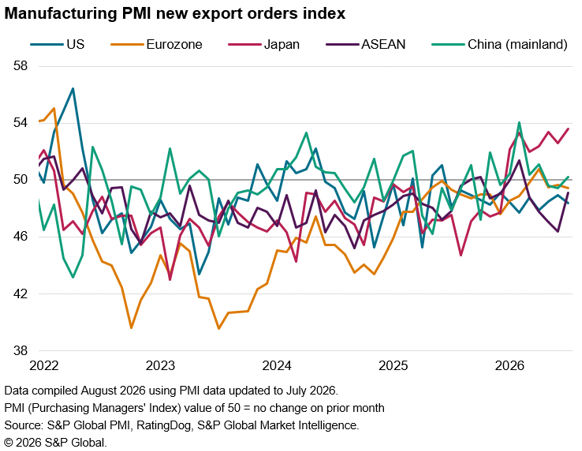
Global goods trade steadied in July, according to the worldwide Purchasing Managers’ Index™ (PMI®) surveys, supported by easing US tariff disruption, precautionary stock building and especially strong demand for AI-related technology equipment. Export growth was strongest in Asia, led by Taiwan, with solid gains also seen in India, Japan, South Korea and Vietnam. However, North American exports fell while Europe recorded a mixed performance, notably including Germany’s sharpest rise since early 2022.
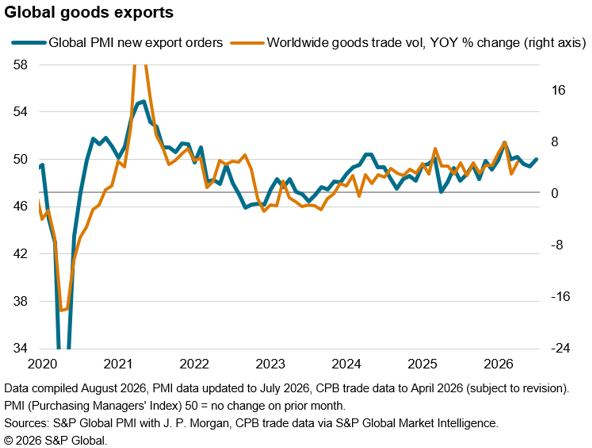
Global exports show strongest annual growth for five years so far in 2026
The seasonally adjusted Global Manufacturing PMI New Export Orders Index, sponsored by J.P. Morgan and compiled by S&P Global, registered 50.0 in July, up from 49.4 in June, rising for the first time in three months to indicate a steadying of global trade volumes.
At current levels, the PMI is broadly indicative of global merchandise trade expanding at a 6% annual rate. So far, 2026 has seen the best performance of the manufacturing PMIs’ global export index for five years.
According to PMI survey contributors, this improved performance has commonly reflected a combination of easing US tariff disruptions and precautionary stock building because of concerns over supply bottlenecks and price rises stemming from the war in the Middle East.
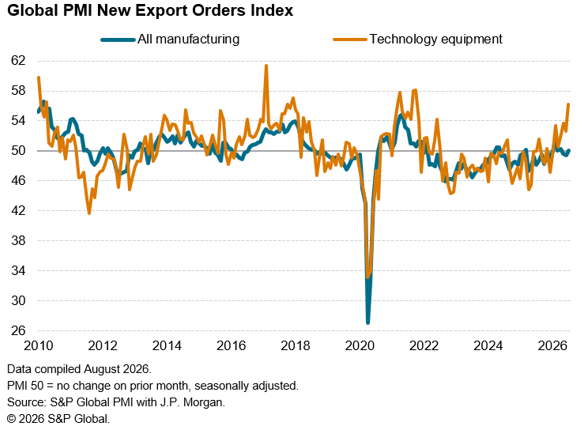
However, recent months have also seen a surge in demand for AI-related equipment. One of the fastest-growing export trade by product category in July was reported for technology equipment, where the rate of growth accelerated to its fastest since the pandemic-related surge in demand for tech products seen in 2021.
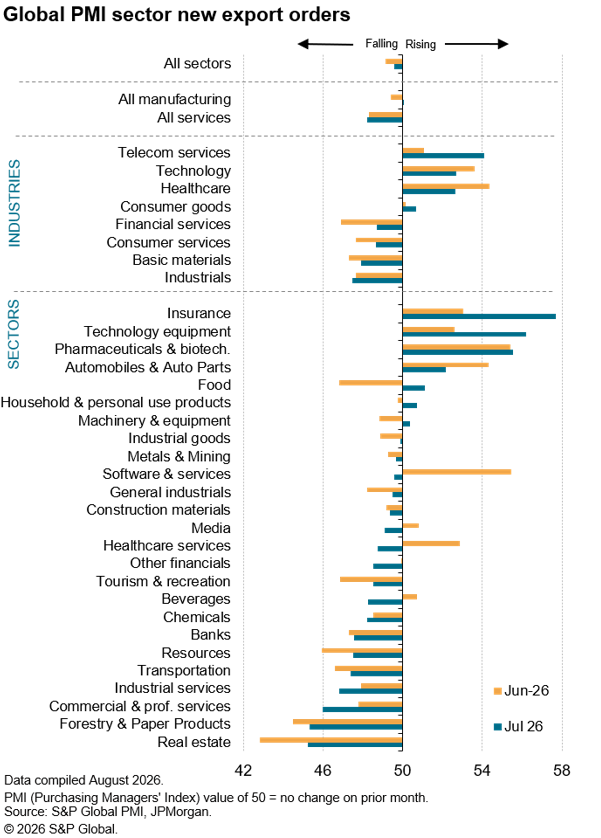
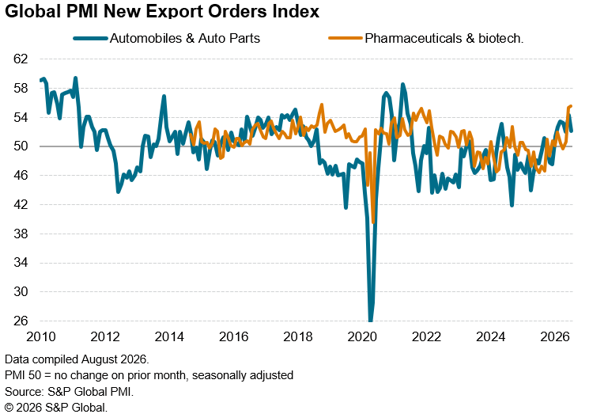
Ongoing stockpiling meant the pharmaceuticals, autos and food sectors were also high up the export rankings in third, fourth and fifth place respectively, albeit with autos growth slipping in July.
Insurance boom
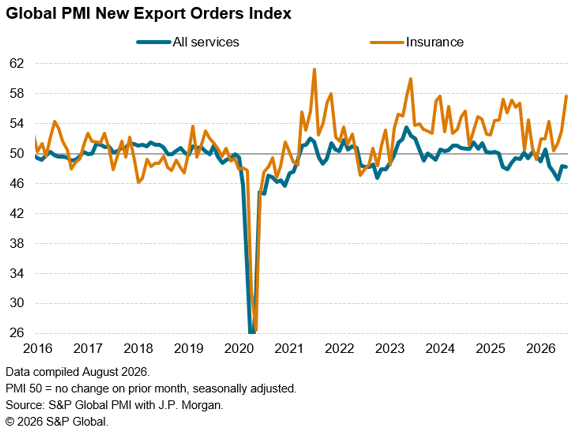
All three top-ranking goods-exporting sectors failed to match the expansion in cross-border trade seen in the insurance services market during July. Insurance exports rose globally at a rate not beaten in two-and-a-half years, contrasting with a fifth straight month of falling services exports worldwide, with rising demand coinciding with heightened concerns over wars and climate change.
Taiwan heads export growth rankings
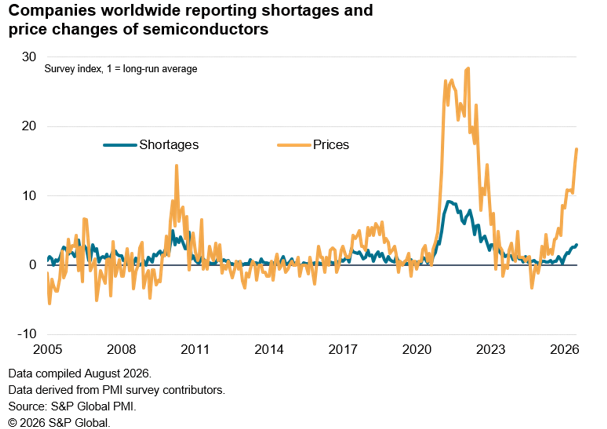
In line with the AI growth spurt, geographically the fastest merchandise export growth was recorded in Taiwan during July, reflecting rising semiconductor demand in particular. Note also that July saw the highest reporting of semiconductor shortages since April 2023 as well as the steepest price jump for semiconductors since June 2022.
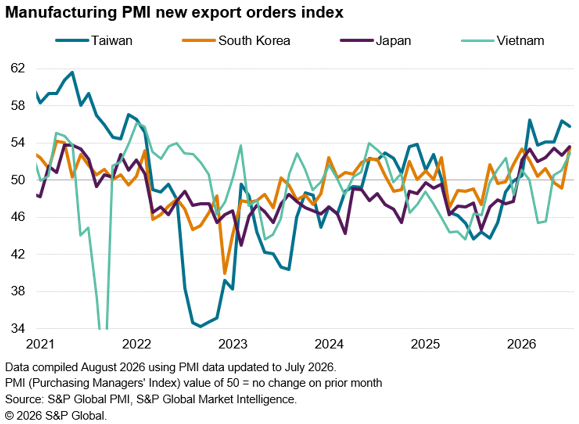
Alongside solid trade gains from India, Japan, South Korea and Vietnam (plus a marginal upturn in exports from mainland China), Taiwan’s export surge helped overall Asian export growth outpace that of other major regions.
Taiwan’s export growth so far this year has been the strongest since 2021, and July saw growth in both Japan and South Korea hit their highest rates since early 2021, with the former buoyed additionally by the weaker yen. Vietnam’s exports meanwhile showed the largest jump for two years, due in part to an easing of global supply chain worries.
North American exports fall
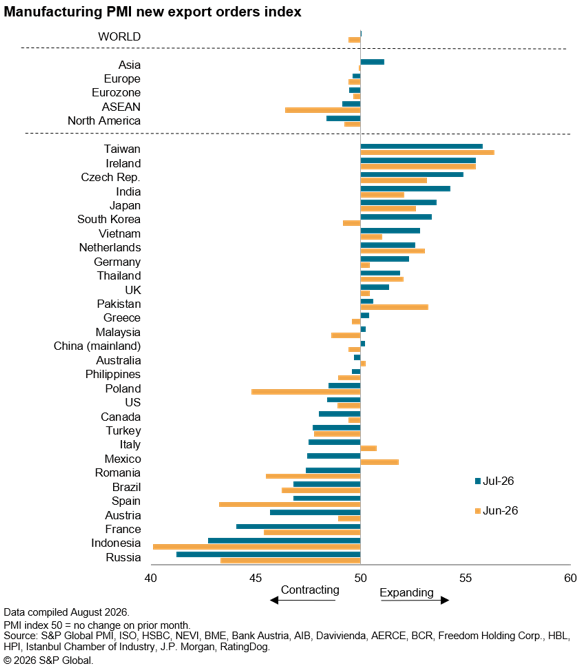
In contrast, the worst-performing region in July was North America, reflecting across-the-board worsening performances amid falling goods exports from the US, Canada and Mexico. However, the worst-performing economies in the world during July, in terms of export performance, were Russia and Indonesia.
European exports fall despite bounce from Germany
European export trends varied, ranging from especially strong gains in Ireland and Czechia, with the latter at a five-year high, and robust increases in the Netherlands and Germany to solid contractions in France, Austria and Spain. Of note, Germany’s export gain in July was the sharpest since February 2022. However, measured across both the eurozone and the wider European continent, goods exports fell slightly overall in July.
© 2026, S&P Global. All rights reserved. Reproduction in whole or in part without permission is prohibited.
Purchasing Managers' Index™ (PMI®) data are compiled by S&P Global for more than 40 economies worldwide. The monthly data are derived from surveys of senior executives at private sector companies, and are available only via subscription. The PMI dataset features a headline number, which indicates the overall health of an economy, and sub-indices, which provide insights into other key economic drivers such as GDP, inflation, exports, capacity utilization, employment and inventories. The PMI data are used by financial and corporate professionals to better understand where economies and markets are headed, and to uncover opportunities.
Read our latest PMI commentary here.
This article was published by S&P Global Market Intelligence and not by S&P Global Ratings, which is a separately managed division of S&P Global.
Theme
Location
Products & Offerings