Research — July 17, 2026
US sports viewing: casual to avid sports fans

By Keith Nissen
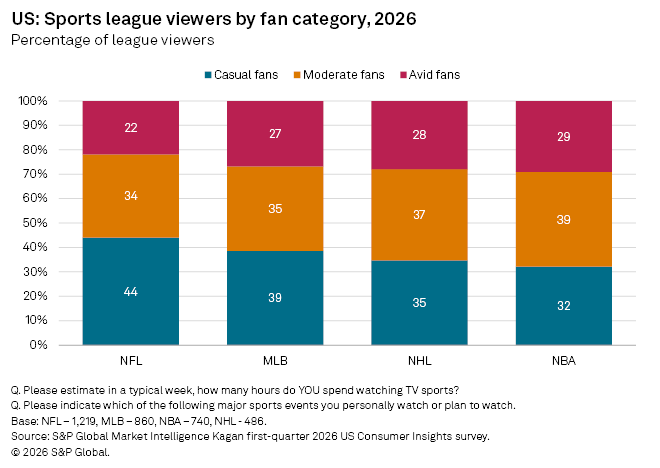
Four in 10 NFL fans are casual sports fans, watching less than 5 hours of live sports per week. Around one-third of MLB, NBA and NHL viewers are also casual sports fans, half of whom are adults over 55 years of age.

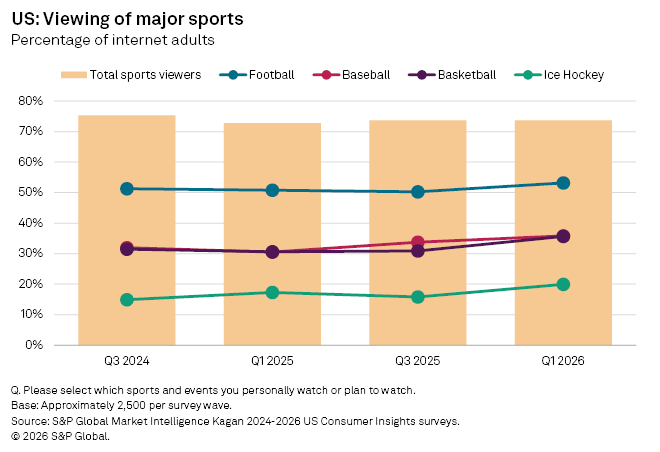
➤ Approximately three-quarters (74%) of Americans watch live sports, with over half (53%) being football fans (NFL or NCAA).
➤ Approximately one-third of Americans watch MLB baseball and/or NBA basketball games.
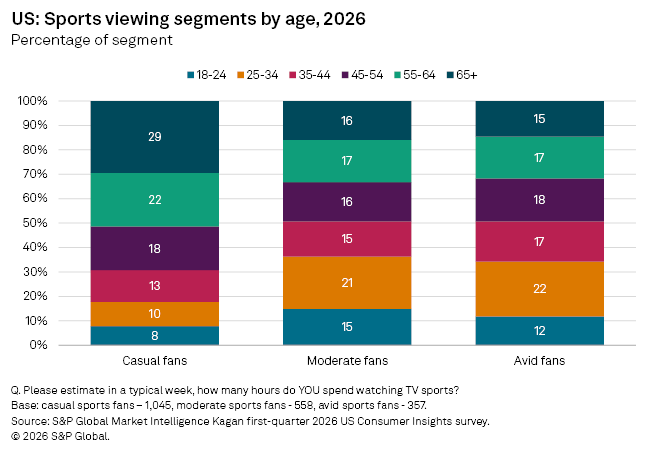
➤ Moderate sports fans (5 to 10 hours of viewing per week) and avid fans (more than 10 hours of viewing) have a very similar age distribution, where one-third is made up of young adults under 35 years of age and one-third is aged 55 and older.
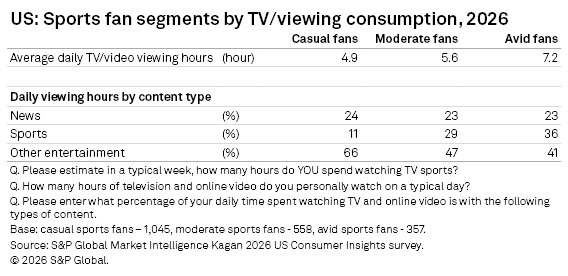
➤ Avid sports fans spend substantially more time per day watching TV/video programming than casual sports fans.

Data collected from S&P Global Market Intelligence Kagan US Consumer Insights surveys conducted over the past two years shows that about three-quarters of Americans watch live sports (of some type). Approximately half of Americans consistently say they watch football (NFL or NCAA). Overall viewership of baseball and basketball are very similar, each with about one-third of Americans as fans. About one in five Americans typically watch ice hockey. Historical survey data shows that viewership of these major sports has remained fairly consistent over the past two years.
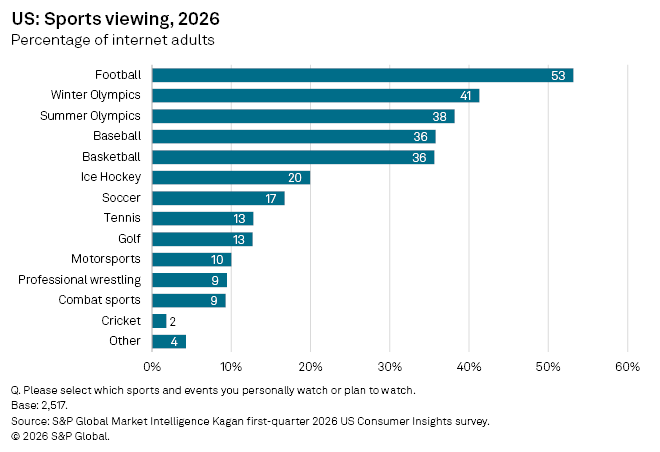
The Kagan first-quarter 2026 Consumer Insights survey found that 53% of Americans watch football. The recently-completed Winter Olympics attracted viewership totaling 41% of US internet adults. Thirty-six percent of surveyed Americans said they watch baseball and/or basketball and 20% watch ice hockey. Relatively few Americans watch soccer (17%), tennis (13%), golf (13%) or motorsports (10%).
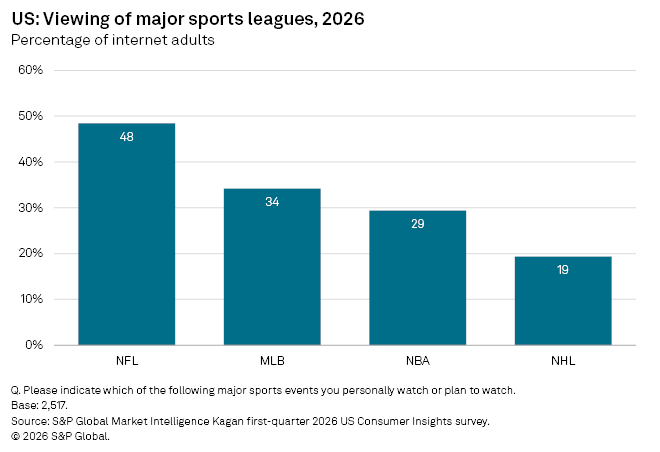
Looking at specific leagues, the 2026 survey results also show that about half of Americans watch NFL regular-season football games. About one-third (34%) watch MLB baseball, 29% watch NBA basketball and 19% watch NHL hockey games.
Based on weekly hours of sports viewing, sports fans were grouped into three segments. Casual sports fans, representing 53% of total sports viewers, were individuals who said they watch less than 5 hours of sports per week. Moderate sports fans said they typically watch 5 to 10 hours of sports per week, while avid sports fans spend over 10 hours per week watching live sports.
Examining these three segments by age reveals that casual sports fans are substantially different than moderate or avid sports fans. Approximately half (51%) of casual sports fans were adults 55 and older. Young adults under 35 represent only 18% of casual viewers. The age distribution of moderate and avid sports appears very similar, with about one-third of each segment being young adults under 35 years old and another third being adults 55 years and older.
The NFL has by far the most viewers of any major professional sport in the US, largely because it attracts the highest percentage of casual sports fans (44%). Similarly, MLB baseball attracts slightly more total viewers than NBA basketball, possibly due to a larger base of casual sports fans. Even the much smaller base of NHL hockey viewers benefits from a substantial portion (35%) of casual fans.
The survey also shows that as time spent viewing sports increases, so does overall consumption of TV/video content. For example, casual sports fans spend an average of 4.9 hours per day watching TV/video programming. In comparison, avid sports fans spend 7.2 hours per day watching TV/video content. Furthermore, the survey data reveals that the percentage of daily TV viewing hours dedicated to watching news programming is not impacted by sports viewing hours. However, the percentage of time spent watching other video entertainment, such as movies, TV series and documentaries declines as sports viewing hours increase.
The Kagan 2024-2026 US Consumer Insights surveys were conducted in March and September of each year, consisting of approximately 2,500 internet adults per wave. The margin of error is +/-1.9 ppts at the 95% confidence level. Survey data should only be used to identify general market characteristics and directional trends.
Consumer Insights is a regular feature from S&P Global Market Intelligence Kagan
This article was published by S&P Global Market Intelligence and not by S&P Global Ratings, which is a separately managed division of S&P Global.
Content Type
Theme
Segment
Language