Research — July 23, 2026
US banks brace for an extended deposit cost squeeze
By Zain Tariq and Xylex Mangulabnan
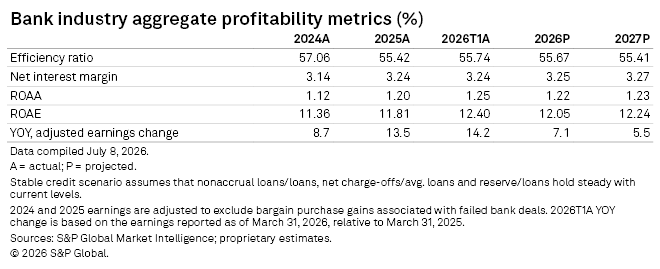
Deposit costs are squeezing margins at US banks and there is no near-term relief in sight, even as certificate of deposit (CD) repricing waves lock in higher funding costs well into 2027. Still, with credit holding up and deal activity accelerating, US bank earnings will continue to grow — though the path to expansion is narrowing.

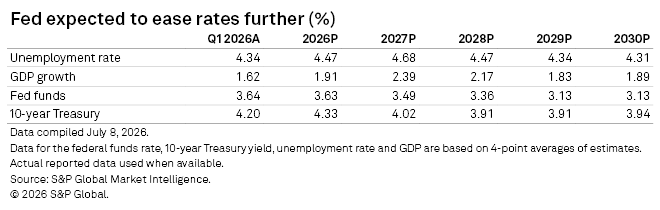
Asset repricing lag following the 2025 rate cuts led to margin contraction in the first quarter of 2026, as loan yield declines took time to materialize while deposit costs remain under pressure from higher-for-longer rates. Despite the compressed margins, earnings continued to grow as credit performance held up — though risks are mounting in commercial real estate and nondepository financial institution (NDFI) exposures, and provisions are expected to rise. Strong fundamentals and a more constructive regulatory tone supported M&A activity, but concerns around private credit, AI disruption and geopolitical instability cooled deal appetite in early 2026; valuations have since recovered and deal activity has picked up as banks look to gain scale and optimize funding profiles. Higher rates and rising credit costs will keep a lid on further margin and earnings expansion.

Click here to access data exhibits and the US banking industry's projections template.
US banks margin expansion streak continued in the fourth quarter as both loan yields and deposit costs declined by 13 basis points following the Federal Reserve's rate cuts; however, the first quarter of 2026 brought a sharp reversal. A pronounced asset repricing lag sent loan yields plunging by 24 basis points, while deposit costs only eased by 17 basis points, leading to margin contraction.
The gap between the federal funds rate and cost of deposits narrowed further during the first quarter to 182 basis points, down from the peak of 323 basis points during the second quarter of 2023. We expect the gap to narrow only modestly in 2026 as rates hold steady for the remainder of the year leading to continued funding pressure.
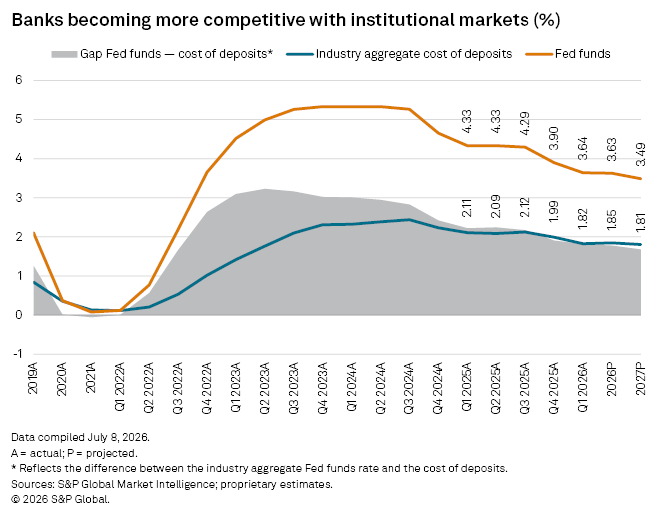
CD rollovers to keep deposit costs elevated
Many banks have already begun raising deposit rates. High-yield certificates of deposit (CDs) have reentered the market, with institutions once again offering rates above 3.5%, after majority of the banks fell out of the bucket in late 2025 and early 2026.
As of June 26, 639 banks marketed rates above 3.5% on a one-year $10,000 CD, down from 1,006 a year-ago but up from 583 since the end of the first quarter. While small, the number of banks marketing rates above 4% also doubled to 40 since the end of the first quarter, although it remains well below compared to 287 banks a year ago.
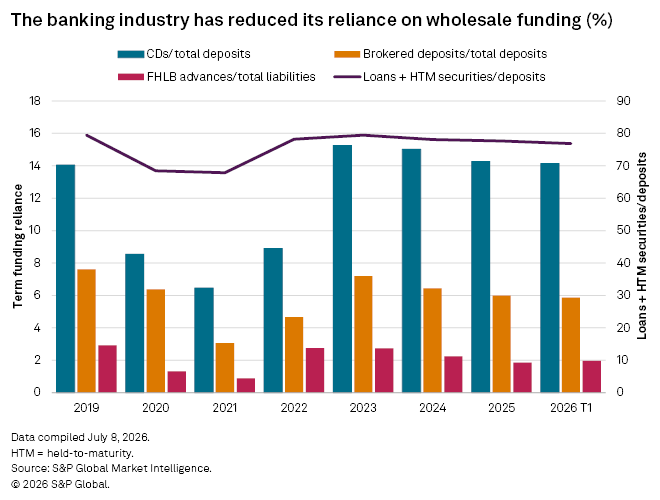
One of the drivers of deposit costs is the maturity schedule of these CDs. 87.2% of the CDs are set to mature in the next 12 months, with 42.4% repricing in the next three months. Only 7% of industry reported lower CD rates as of June 26, compared to three months ago. When these CDs roll over, banks will have to meet the market rates, locking in higher funding costs well into 2027.
US banks reported strong deposit growth during the first quarter, fueled in part by higher tax refunds this year. However, the momentum has faded with the Federal Reserve's weekly H.8 report on estimated assets and liabilities that showed growth at domestically chartered US banks slowed to 0.9% on a seasonally adjusted basis during the second quarter through June 17 and declined 0.4% on a non-seasonally adjusted basis. We expect growth to stay muted for the rest of the year as banks battle for cheap deposits and compete with alternatives in the markets. Non-interest-bearing deposit concentration rose for the first time in four years, up 22 basis points during the first quarter to 20.23% but remained below pre-pandemic levels. We expect non-interest-bearing deposits to fall slightly to 20.2% of deposits by year-end 2026.
Rates are not the only factor impacting deposit competition as stablecoin adoption grows and some banks worry about increased competition, particularly from fintechs. New charter applications have risen significantly over the last year and a half, with many nonbanks gaining access. Halfway through 2026, regulators have received nearly as many applications as in all of 2025 which recorded by far the highest number of applications received in a single year since the global financial crisis.
Credit trends remain resilient, but risks are mounting
Credit performance remains remarkably resilient, a testament to strong household balance sheets and the protective effect of locked-in, low-rate mortgages. With pandemic-era excess savings largely depleted, consumers are feeling the pinch, but defaults have yet to spike. Delinquency rates in consumer and commercial portfolios remain within historical norms.
Delinquencies and loss rates in commercial real estate stabilized after rising sharply in 2024. However, many banks have resorted to "extend and pretend" strategies, rolling over maturing loans to avoid forcing borrowers into refinancing at today's punitive rates. While it buys time, it delays inevitable losses in some portfolios if rates remain higher for longer.
Some concerns around private credit remain as loans to nondepository financial institutions continue to grow at a faster pace compared to traditional loan categories. Lack of transparency into how the growth is being generated and indirect exposure to fast growing areas such as AI infrastructure financing, venture debt and leverage buyouts has raised red flags. Risks in the sector became more prominent after two large NDFIs filed for bankruptcy in late 2025. So far, those instances seem to be isolated; however, regulators and investors continue to monitor these loans more closely as banks expand in this area.
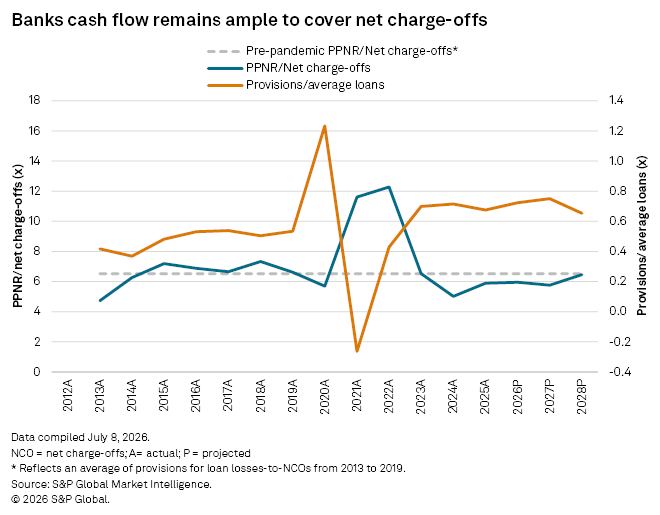
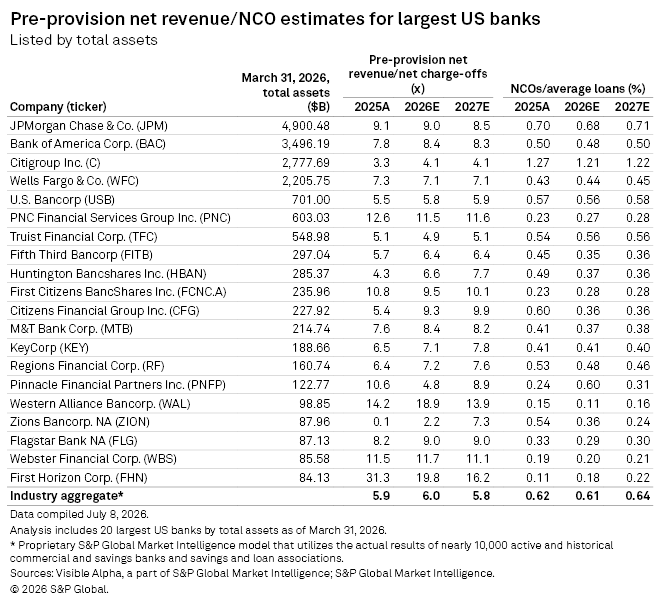
We expect loss content to rise despite benign credit quality year-to-date through March 31. Provisions dipped to 17.4% of net revenue in the first quarter of 2026 from 18.7% in 2025 but are expected to grow to 19.8% this year and to 20.3% in 2027 as banks eye economic uncertainty. On average, from 2013 to 2019, banks' provisions equated to 14.6% of net revenue. The higher level of provisioning will serve as a modest headwind, but earnings are still expected to rise 7.1% year over year in 2026 and grow another 5.5% in 2027.
We expect loan growth to slow from 2025 levels. Despite easing regulations, new loans will be difficult to come as banks continue to face competition from nonbanks. Funding these loans will also become more expensive as banks battle for deposits by marketing higher rates or turning to more expensive borrowings.
M&A: Back in motion, with purpose
Dealmaking entered 2026 on a strong footing — favorable fundamentals, improving valuations and a more constructive regulatory posture all pointed toward elevated activity. That momentum was interrupted in the first quarter by concerns around private credit risk, AI-driven disruption and geopolitical instability, which pushed valuations lower and cooled appetite. The pause was temporary.
By the end of the second quarter of 2026, deal activity had rebounded, with 45 transactions announced in the quarter compared to 36 in the first quarter and 40 in the year-ago period. More notably, the pace of approvals has accelerated sharply with the median time to deal completion only at 94 days in 2026, down from 134 days in 2025 and 187 days in 2024, when heightened regulatory scrutiny slowed the pipeline significantly.
The strategic rationale for consolidation includes a wide variety of factors such as scale, liquidity optimization, stronger deposit franchises and balance sheet remixing to shed lower-yielding legacy securities. As earnings come under incremental pressure from higher funding costs and normalizing credit, the case for strategic combinations grows stronger. Expect deal volumes to remain elevated through 2027, with larger, more transformative transactions likely as banks exhaust organic levers.
Looking ahead
US banks are navigating a complex, multi-variable environment with more discipline than the macro backdrop might suggest. Margins are compressed but not collapsing. Credit is holding but warrants close monitoring — particularly in CRE and NDFI exposures. Earnings growth is positive but decelerating. And the structural funding challenge — CD repricing, deposit competition, and rising alternative pressures — will be a persistent drag through at least 2027.
Not all banks are equally equipped to absorb the pressure. Stronger institutions enter the second half of 2026 with the balance sheet flexibility and earnings momentum to act — pursuing acquisitions, optimizing funding and extending competitive advantages. For others, the margin for error is shrinking — banks still generating returns below their cost of equity face mounting pressure to reconsider their stand-alone path, and a prolonged high-rate environment only compounds that urgency. Valuations have recovered from their first-quarter lows, but they remain vulnerable — renewed market volatility, lingering concerns around private credit and indirect NDFI risk, or a broader deterioration in the macro outlook could re-test investor confidence and cool deal appetite again. Deal activity is likely to accelerate as the divide between the well-positioned and the structurally challenged widens, but the pace and scale of that consolidation will depend heavily on how those valuation risks resolve. Whether 2026 delivers on its early promise will ultimately come down to execution, and to whether reported results are strong enough to hold the macro skeptics at bay.
This article was published by S&P Global Market Intelligence and not by S&P Global Ratings, which is a separately managed division of S&P Global.