Research — July 17, 2026
Slack demand, surging inventory pressurize US coal prices

By Steve Piper
Domestic coal producers cited cost pressures and low demand as factors reducing earnings during the first quarter of 2026. Asia-Pacific demand for coking and thermal coal may help close the gap, but energy markets remain unsettled as the Hormuz crisis eases. Higher stockpiles coming out of the spring months worked to pressurize US prices in June.
Federal policy actions — including delayed coal plant retirements, and funding for coal plant refurbishment and unit additions — have underpinned a more stable demand and regulatory landscape for coal. While firmer natural gas prices supported coal generation via gas-to-coal switching in 2025, high coal stockpiles are forecast to constrain production through 2027. After 2027, the US coal market will face renewed pressure from the expansion of solar and wind generation in regions with supportive economics and state policies.
In the longer term, the S&P Global Market Indicative Power Forecast projects coal plant retirements and reduced utilization. By 2035, 36.1 GW of coal plants are forecast to retire. Coal plant generation share through 2035 is forecast to decline to 8.7% from 17.1% of total generation in 2027.

➤ Domestic coal prices fell during June amid persistent, low demand and weaker-than-expected export markets.
➤ Near-term tailwinds for coal include anticipated electricity demand growth and supportive federal policies, while countervailing pressures include elevated domestic coal inventories and competitive natural gas in some regions of the US.
➤ In the longer term, S&P Global Market Indicative Power Forecast projects 36.1 GW of coal plant retirements by 2035, amid market pressure to retain existing coal and natural gas generation. This pressure is attributed to several factors, including elevated natural gas prices, high demand growth and delays in deploying new gas generation.

Coal benchmark prices fell during June, amid high stockpiles and steady natural gas prices. Export benchmark prices led declines, with CAPP region export benchmarks at $82.00/short ton, down by $4.00/st (4.7%), NYMEX CAPP at $80.00/st, also declining $4.00/st, and NAPP Pittsburgh Seam 13,000 British thermal units per pound holding at $71.00/st. Domestic coal benchmarks also declined, with Illinois Basin 11,500 mid-sulfur falling 75 cents/st to $55.25/st (1.3%), while the NYMEX Powder River Basin benchmark shed 50 cents/st to $14.70/st (3.3%).
Global crude oil and natural gas prices fell in June as the Hormuz crisis eased, but US natural gas prices remained unaffected, following normal seasonal trends. Henry Hub spot prices opened June at $3.04/million Btu, increasing throughout the month on warm weather to close at $3.33/MMBtu. Spot prices averaged $3.15/MMBtu for the month. Seasonal storage injections continued, with working gas at 2,835 billion cubic feet, as of June 19. This was 152 Bcf above the five-year average and 49 Bcf above the same week of 2025.
With gas availability holding steady, regional gas market discounts followed suit. Chicago Gate averaged $2.73/MMBtu, a $0.42/MMBtu discount to Henry Hub. TCO Pool's discount was $0.73/MMBtu for a monthly average of $2.42/MMBtu, while TETCO M3 moved to a discount of $0.76/MMBtu for a monthly average of $2.39/MMBtu. Strong discounts continued in the Western US, with SoCal Border again coming in at a nationwide low of $2.04/MMBtu during June, $1.11/MMBtu below Henry Hub.
The US Energy Information Administration (EIA) estimated March 2026 coal stockpiles at 111 million st, 6 million st higher than February levels. The growth in inventory represents a lagging indicator of surplus coal coming out of the spring shoulder season.
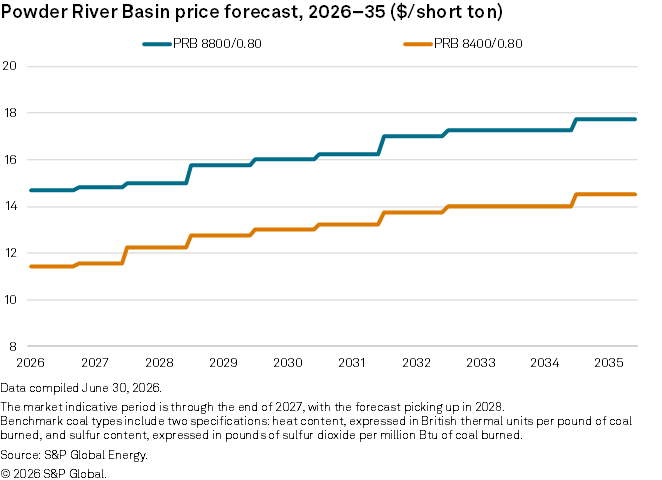
Current forward pricing for Powder River Basin (PRB) coal has been flat and stable, reflecting sufficient power-plant inventories and mining capacity to accommodate demand changes. After 2027, lower natural gas prices and declining coal demand are forecast to restrain price growth.
Bituminous coal prices are primarily influenced by export markets, with today's prices making domestic coal generation generally less competitive with Northeast natural gas. The current disruption in international energy markets has elevated export coal prices, likely through 2027. As natural gas prices normalize after 2027, we project coal prices to ease.
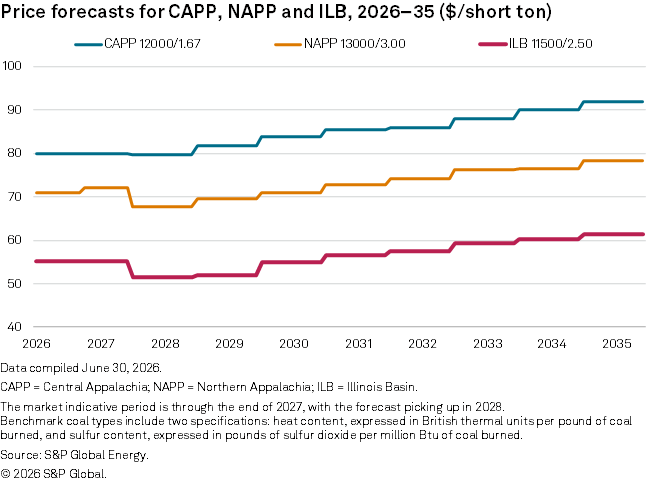
Pricing benchmarks exceeding $70/st suggest sustainable returns for eastern bituminous coal, with Atlantic Basin export coal above that threshold and coal competing in Pacific Basin export markets generally much closer. Bituminous coal demand for electric generation is expected to remain stable through 2027, driven by higher electricity demand and supportive natural gas prices. Declines in steam coal demand are expected to resume after 2027, and overall Eastern US coal demand is forecast to decline 50 million st in 2025–30.
Outlook for US coal production, demand
For the four weeks ending June 20, coal shipments again averaged 9.5 million st, 8.3% below the same period in 2025. Relatively low shipments indicate that high inventories are constraining production, even as summer demand begins to pick up.
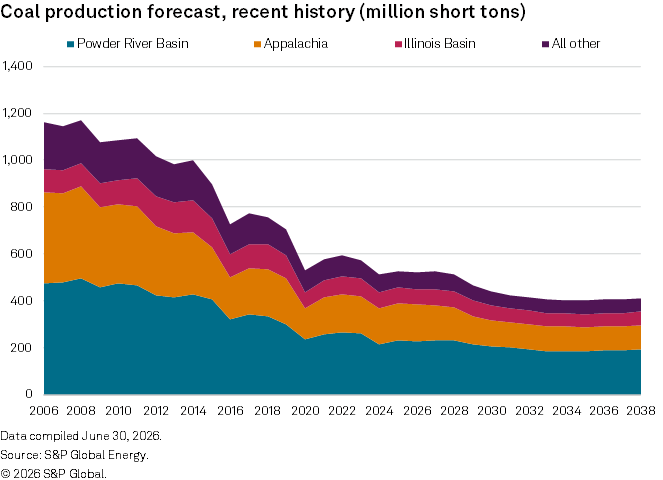
The chart below compares the current production forecast with recent history. Where previously we forecast overall production growth in 2026, we now forecast a small year-over-year decline to 522 million st. We forecast similar coal production in 2027, with higher natural gas prices offset by robust inventories. Beginning in 2028, growth in green generation is forecast to pressure coal generation lower. The overall coal market — comprising domestic demand and exports — is forecast to decline 109 million st between 2026 and 2031.
Production outlook — Powder River Basin
Production reports of the Mine Safety and Health Administration (MSHA) covering the first quarter of 2026 indicate year-to-date production of 57.0 million st, an annualized rate of 228.0 million st. Production for 2026 is now forecast at 228 million st, slightly below 2025. Production is forecast to remain elevated through 2028 against higher natural gas prices. S&P Global Energy projects that coal retirements in the Midwest and expansion of wind generation in PRB's core markets will gradually shrink the coal demand to 204 million st by 2030, declining further to 184 million st through 2035.
Production outlook — Illinois Basin
MSHA's first-quarter 2026 production reports indicate year-to-date production of 15.9 million st, an annualized rate of 63.6 million st. We forecast production will grow modestly from 66 million st in 2026 to 68 million st through 2028, after which the expansion of wind generation and announced coal retirements are expected to erode the ILB coal demand. Coal production in the ILB is forecast to fall to 64 million st by 2030, declining further to 56 million st by 2035.
Production outlook — Appalachian basins
MSHA's production reports for the first quarter of 2026 indicate year-to-date production of 39.2 million st, an annualized rate of 156.8 million st. Appalachian coal demand tends to be more sensitive to global seaborne markets than to domestic natural gas prices, compared to PRB or ILB. Thus the demand increase versus natural gas generation that is expected to benefit PRB and ILB will be much more limited. We forecast modest declines from 2025 levels through 2027. As remaining domestic demand erodes after 2027, with only modest offsets from export growth, Appalachian production is forecast to fall to 112 million st by 2030.
Further information
Market Indicative coal forecasts by S&P Global Energy represent forward curves for spot-traded instruments, analogous to a strip of contracts. The shorter tenors — current year and prompt year, plus additional years, if available — are driven by the observed/assessed marker prices. The longer tenors — typically forecast years three to 20 for physically assessed markers — are driven by fundamental estimates of cash costs of production, accepted returns to capital, regional productive capacity, and forecast supply and demand. For the long-tenured portion of the curve, S&P Global Energy forecasts prices for specific coal markers and defines the remaining markers via historical spreads.
Regulatory Research Associates is a group within S&P Global Energy.
S&P Global Energy produces content for distribution on S&P Capital IQ Pro.
For further details on coal prices, supply and demand, visit the S&P Coal Forecast Summary page.
This article was published by S&P Global Market Intelligence and not by S&P Global Ratings, which is a separately managed division of S&P Global.