


Blog — 20 Apr, 2026
Middle East and Africa Credit Risk Quarterly Update: Corporate LGD Trends for Q4 2025
Executive Summary
Loss Given Default (LGD) is one of the most intuitive ways to think about downside in credit: if a company defaults, how much of the exposure might not be recovered? In this first post of our quarterly series, we summarize LGD estimates as of Q4 2025 for corporate constituents of the S&P Dow Jones Middle-East and Africa BMI Index, using the S&P Global Market Intelligence LGD scorecards.
We observe several clear patterns:
- The median LGD is around 42%, with most issuers falling in the 0%-70% rage and only a small tail at the higher end.
- The materials sector shows relatively low LGD estimates while asset-light sectors tend to exhibit higher LGDs.
- We observe country-specific differences, reflecting both structural and compositional factors
- Lower rated cohorts don’t always display higher LGDs, except the ccc- grade.
This series is intended as a recurring “market temperature-check”, not just to report numbers but to interpret what may be driving recovery expectations across sectors and regions. The future editions will also compare headline changes versus the previous quarter.
As of Q4, the PiT estimates do not consider the negative effect of the regional conflict.
The dataset
We used the constituents of the S&P Dow Jones Mid-East and Africa Emerging BMI Index as a representative sample of issuers in the Middle East and Africa region. From the 500 index constituents, 401 are corporate entities, of which we have sufficient information to estimate LGD for 391. The basis of this post is the LGD estimates of these 391 corporates.
Calculating LGD
For this blog, we used the S&P Global Market Intelligence LGD scorecard, which is designed to estimate LGD at the exposure level (i.e. facility level), and produces estimates of loss given default, which are point-in-time (PiT), reflecting the current economic conditions. This feature captures the fact that default during an economic downturn is typically accompanied with lower recoveries. We forecasted LGD for 391 entities from the index constituents and found that the mean LGD was 38.7% and median was 41.2%. We expect average LGD to sit above the median in periods/universes where high-LGD tail names exist. In quarterly series, tracking the gap between mean and median could be useful “stress indicator”, where a widening gap can signal a fatter high-LGD tail. Also interesting is that the average LGD is slightly lower than the 45% standardized estimate accepted and used by various financial institutions in the region. Please see the section Data and Assumptions below for data sources and assumptions.
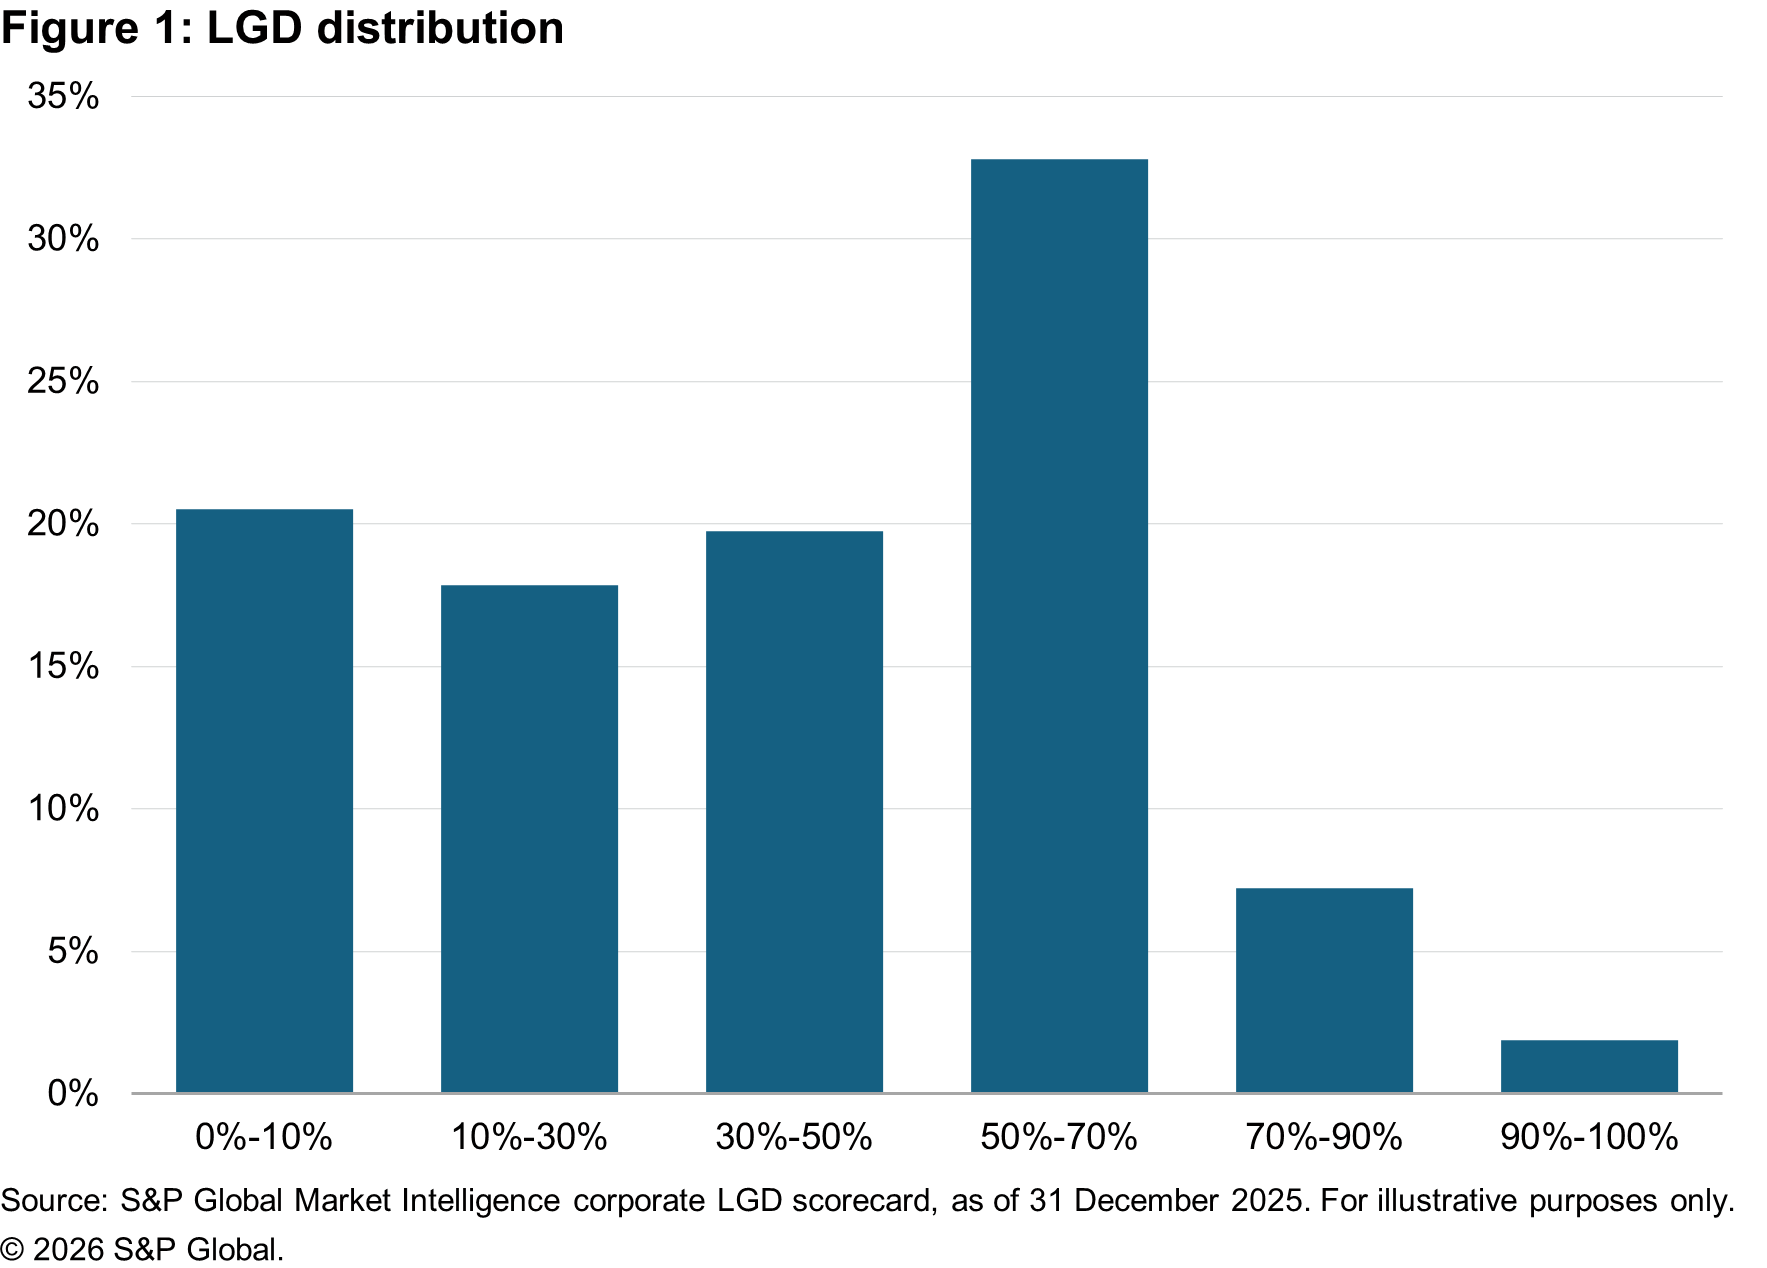
LGD Buckets Distribution
Figure 1 below displays the distribution of the LGD results across six buckets. The first bucket (0%-10%) is for those entities associated with a minimal loss, should they default, while the last bucket (90%-100%) is for those entities associated with a maximum loss. The universe in Q4 appears barbell-like with many firms either in the very low LGD bucket (21% in the 0%-10% bucket) or in significant loss (33% in the fourth bucket with 50%-70% LGD). This observation is in line with the empirical bimodal character of observed recoveries. However, the distribution in Figure 1 indicates that the 45% standardized LGD rule is underestimating or overestimating most cases in our study.
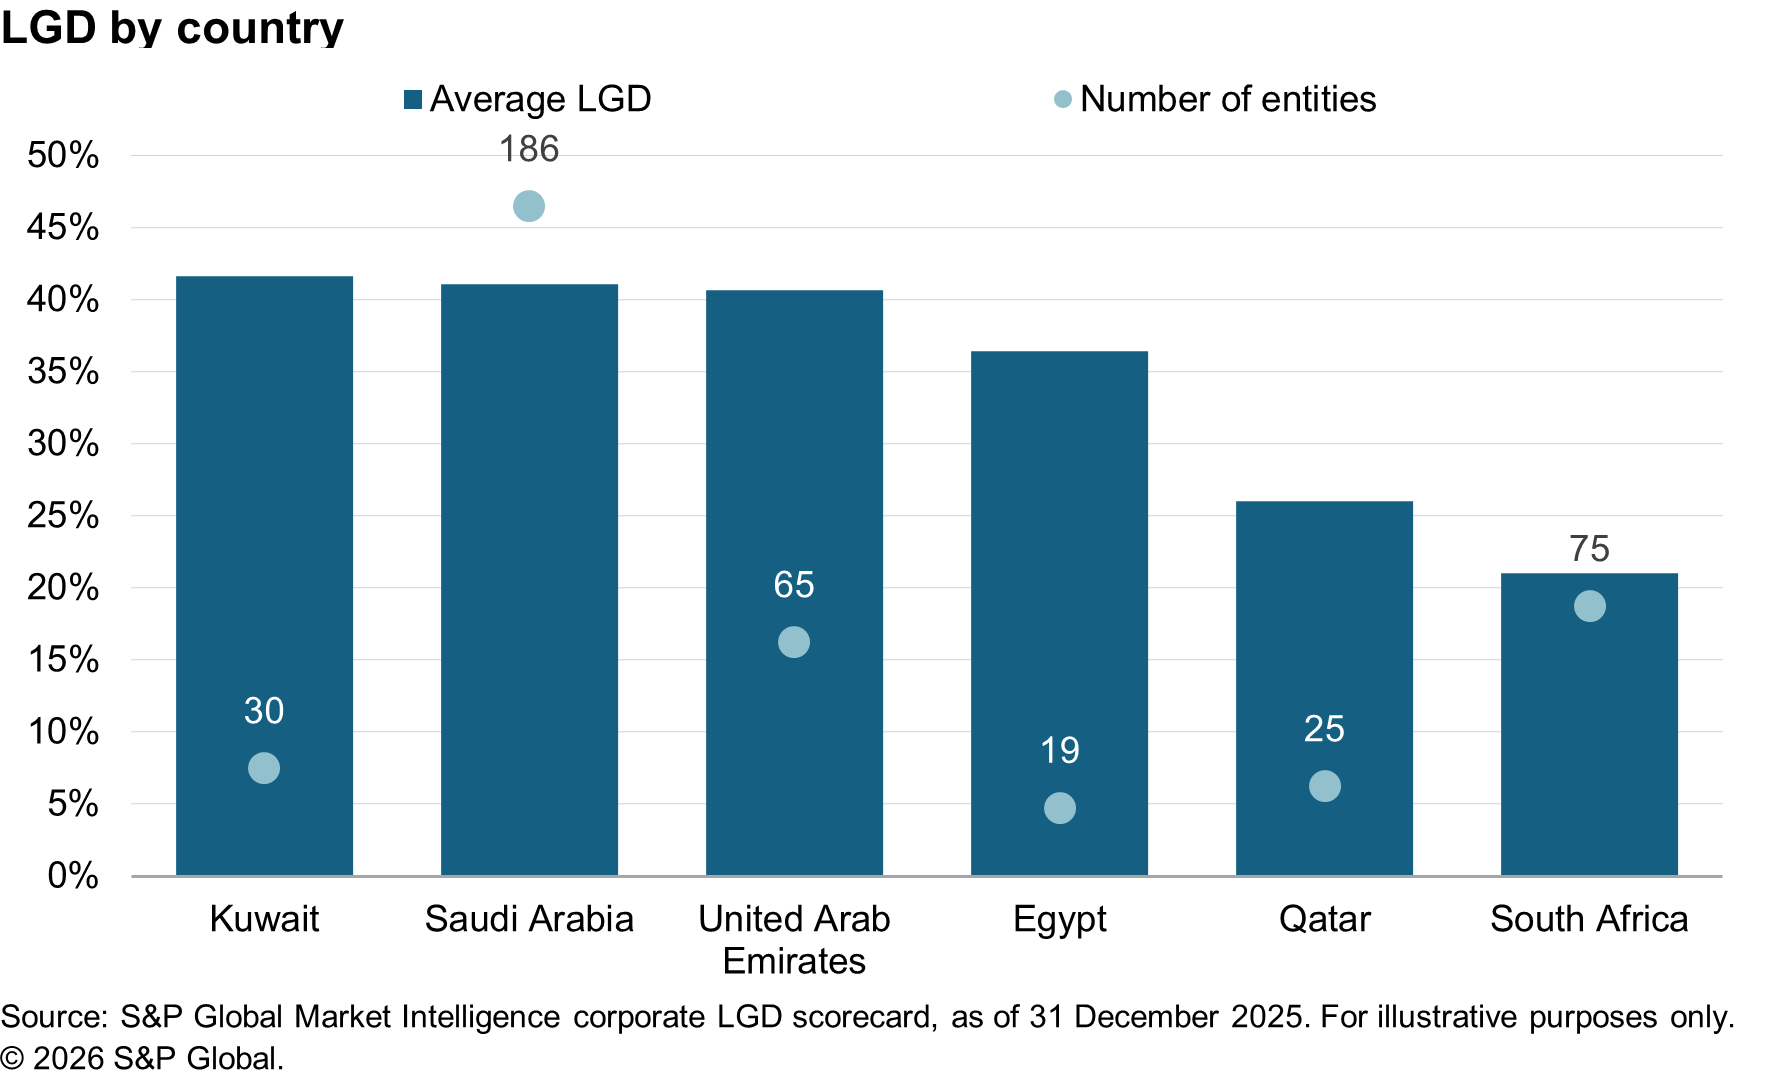
Country lens: where is LGD risk concentrated
We examine the average LGD levels within countries and key underlying drivers. The dataset is well represented by the large issuing corporates in the region, with Saudi Arabia and South Africa representing the largest set of corporates. A country lens helps separate what may be structural (legal regimes, insolvency processes, collateral enforceability) from what is compositional (which sectors dominate that country’s index constituents).
For Saudi Arabia, largest buckets are 0%-10% bucket dominated by materials companies (Oil & Gas, chemicals), and 50%-70% bucket is dominated by diversified sectors. Tail of very high LGD represented by consumer discretionary companies
In South Africa, the lower LGD buckets (0%-10% and 10%-30%) are dominated by natural resources companies. This is intuitive: these firms tend to have high economic values driven by reserves and asset-heavy balance sheets.
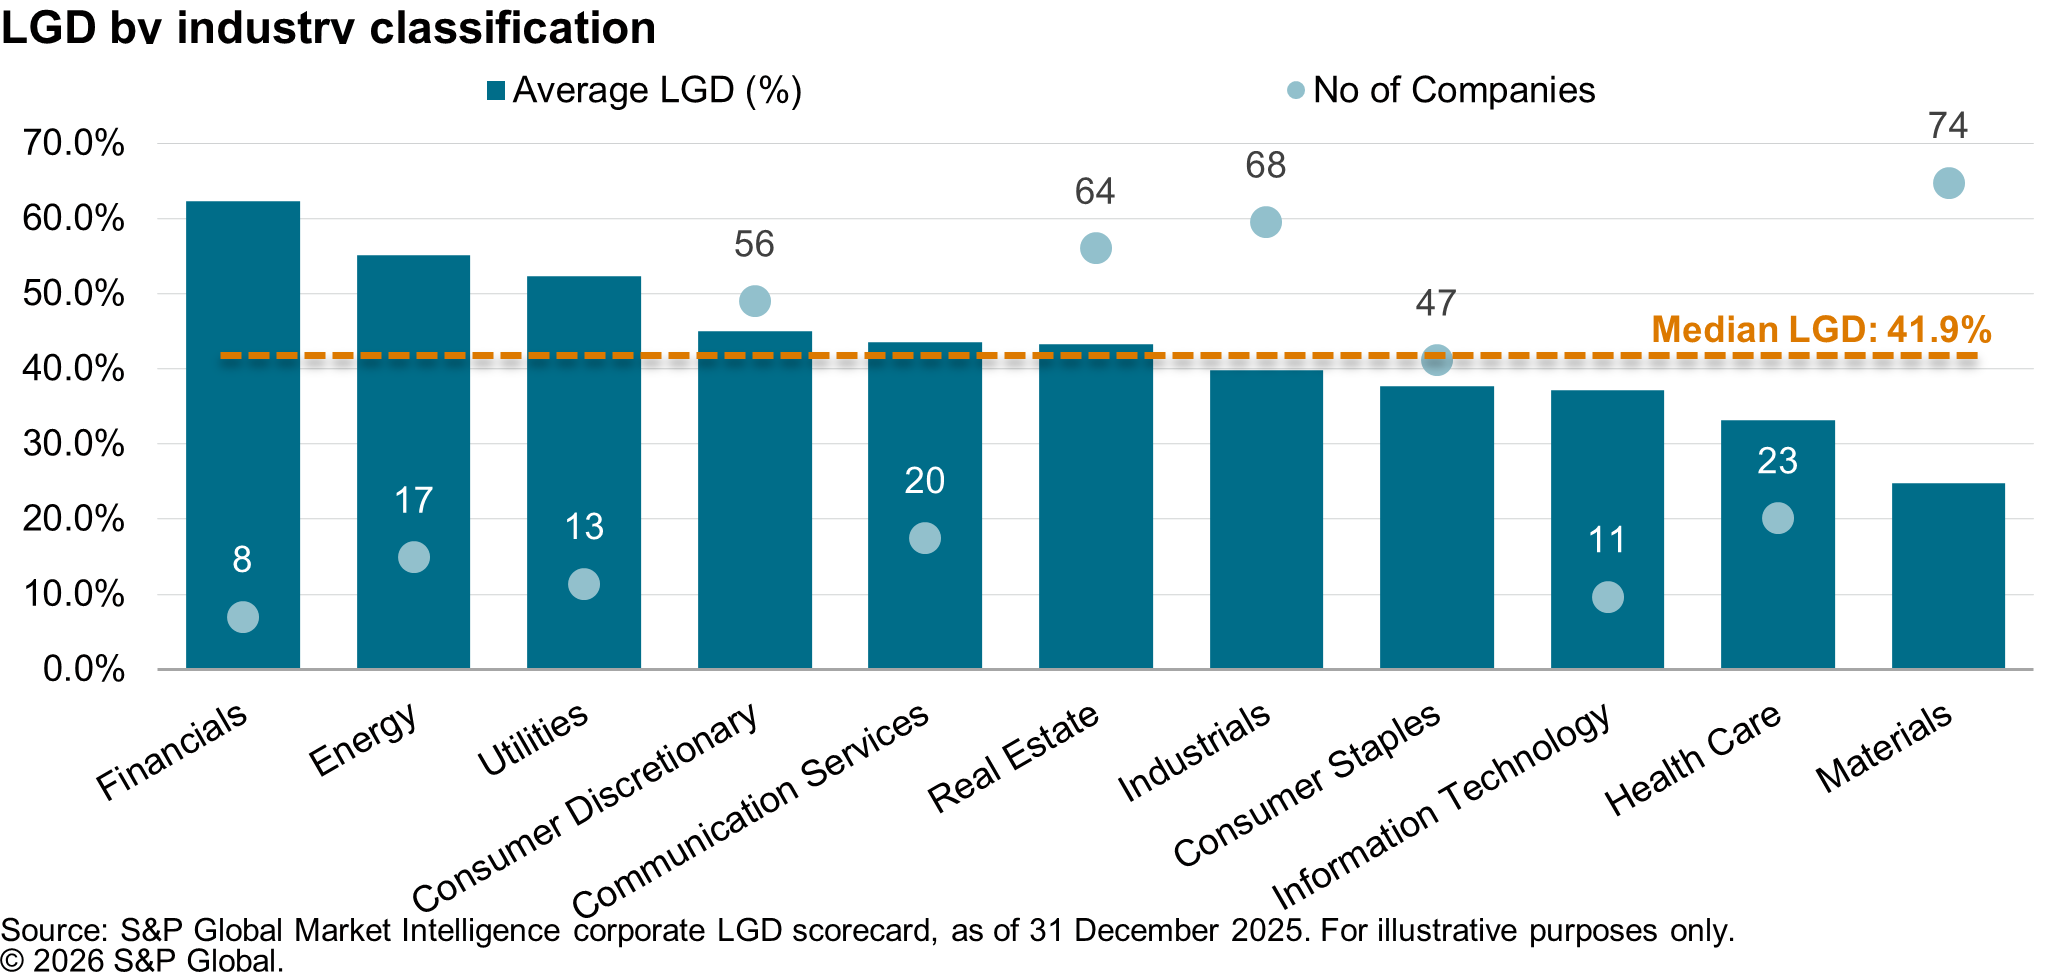
Sector/Industry lens: Which sectors are driving the LGD and where is the tail
Next, we study the trends by industry. This dataset, summarized in Figure 3 below, shows that several Materials names are associated with very low LGDs. A plausible explanation is that many such companies are asset-rich (plants, reserves, inventory, exportable commodities), and in a default scenario, tangible assets and monetizable reserves can support higher recoveries – especially if asses have value beyond the going concern and can be sold or redeployed.
Conversely, higher LGDs often cluster where recoveries depend more on enterprise value and less on collateral, e.g. certain retail, services, airlines or highly leveraged real estate development structures. Examples of high LGD points include Passenger Airlines and select discretionary/consumer names.
Another nuance is that real estate, while often “asset heavy”, can still show mid-to-high LGD when:
- Cyclicality of the sector introduces volatility, and a bigger haircut to the EVs
- Assets are pledged senior in the structure
- Projects are incomplete, or
- Cash conversion is uncertain
The dataset includes many Real Estate names in 50%-70% LGD buckets, including developers and REIT-like companies, suggesting that asset type and financing structure matter as much as asset presence.
Figure 3: LGD by Industry Classification
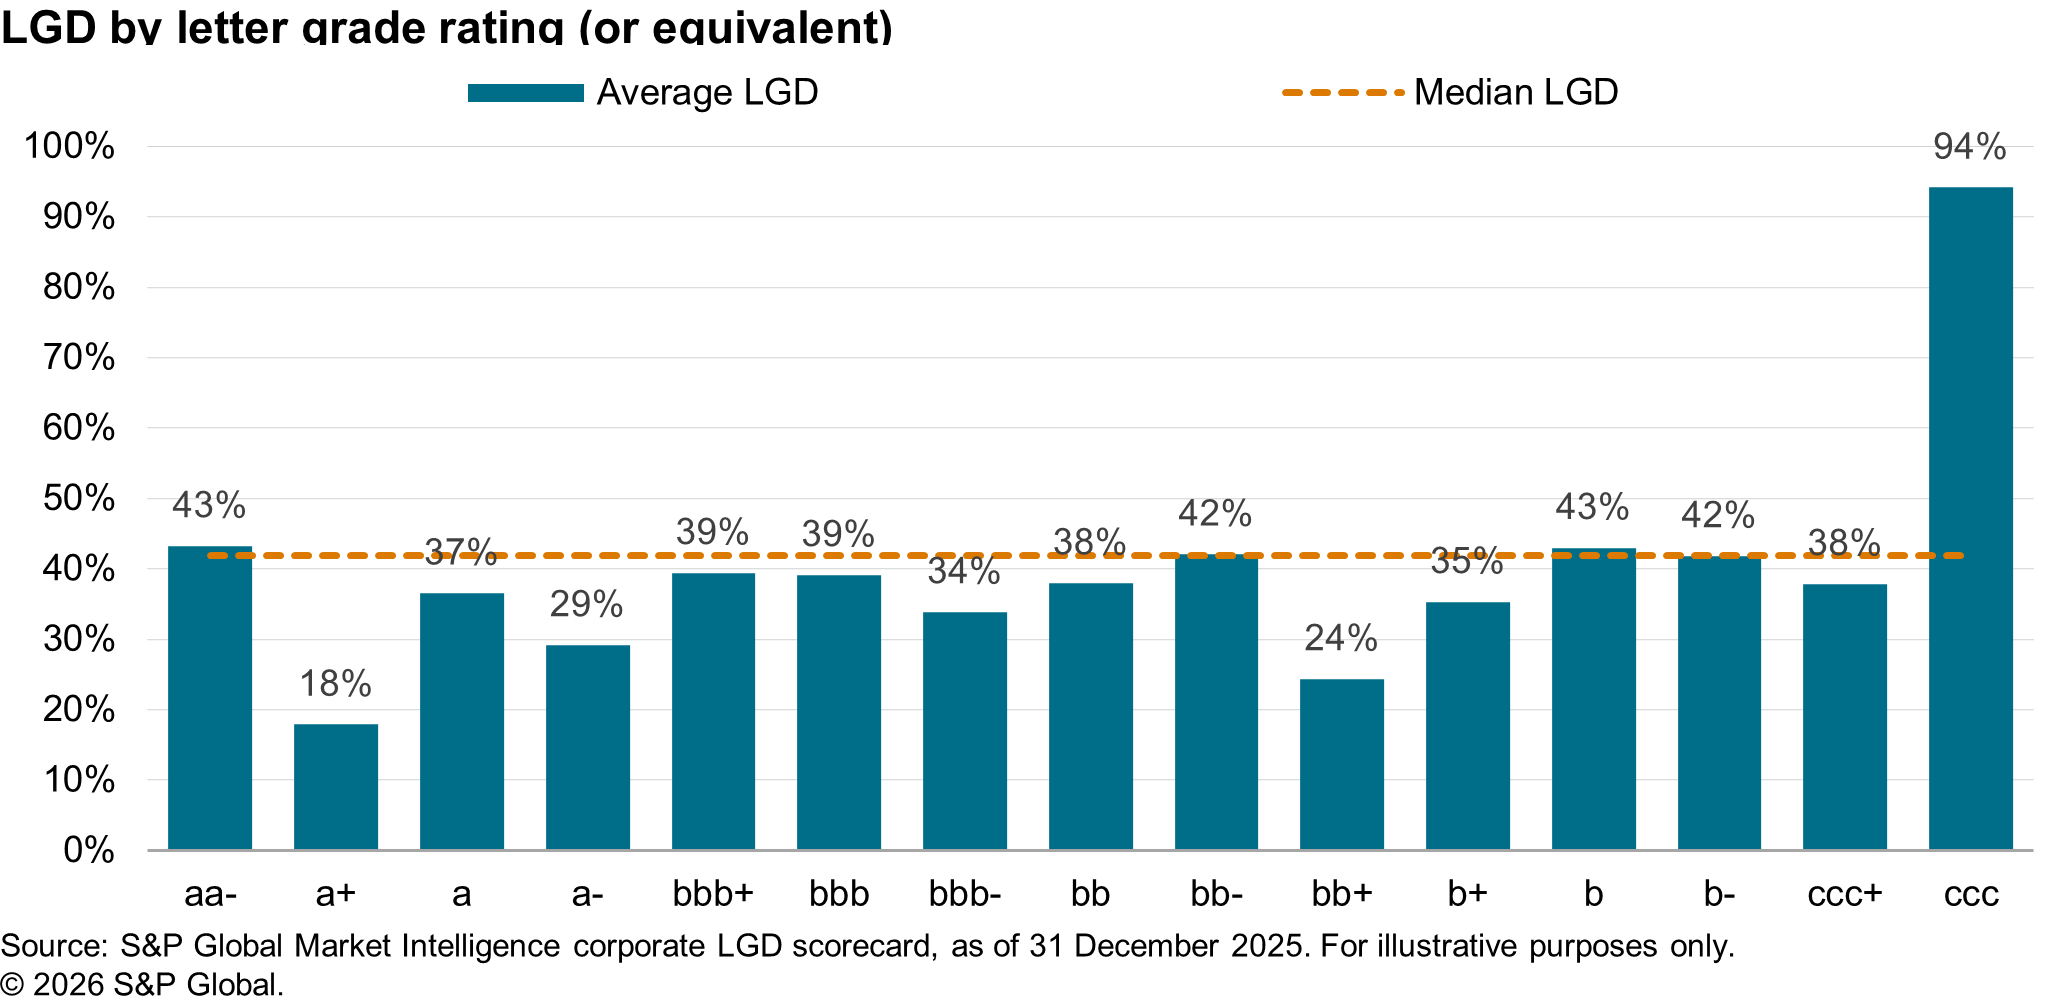
LGD by letter-grade ratings: does LGD align with credit quality?
In Figure 4 below, we show LGD distribution by rating category. This helps the users test whether dataset aligns with intuition: weaker credit quality often coincides with more loss severity. As the data indicates, this is not always true, especially for low-default asset classes, because LGD is more “balance sheet and collateral” than “probability”.
Figure 4: LGD by letter grade rating (or equivalent)
Data and Assumptions
A key assumption made was that each exposure is senior unsecured and that all the liabilities of each entity are ranking pari-passu to each other, unless identified specifically as senior or junior to the facility debt. In other words, the bank holding a bond/loan issued by one of these entities is going to have a claim against the assets of the entity, should this default, that is equal to the claim of other liability holders (including non-financial liabilities). We used the financial data from the Capital IQ platform from the latest available reported financials. The LGD model takes into consideration various factors, as reflected above and further expanded upon in “Models and methodology” section below. For one of the inputs in the LGD model, viz. PD Rating of the Obligor, we used external credit rating for the entity, and where no external rating was available we used a proxy score in the form of output of S&P Global Market Intelligence CreditModel®, which is a statistical model trained on S&P Global Ratings data that uses company financials to generate credit scores1.
Models and methodology explained
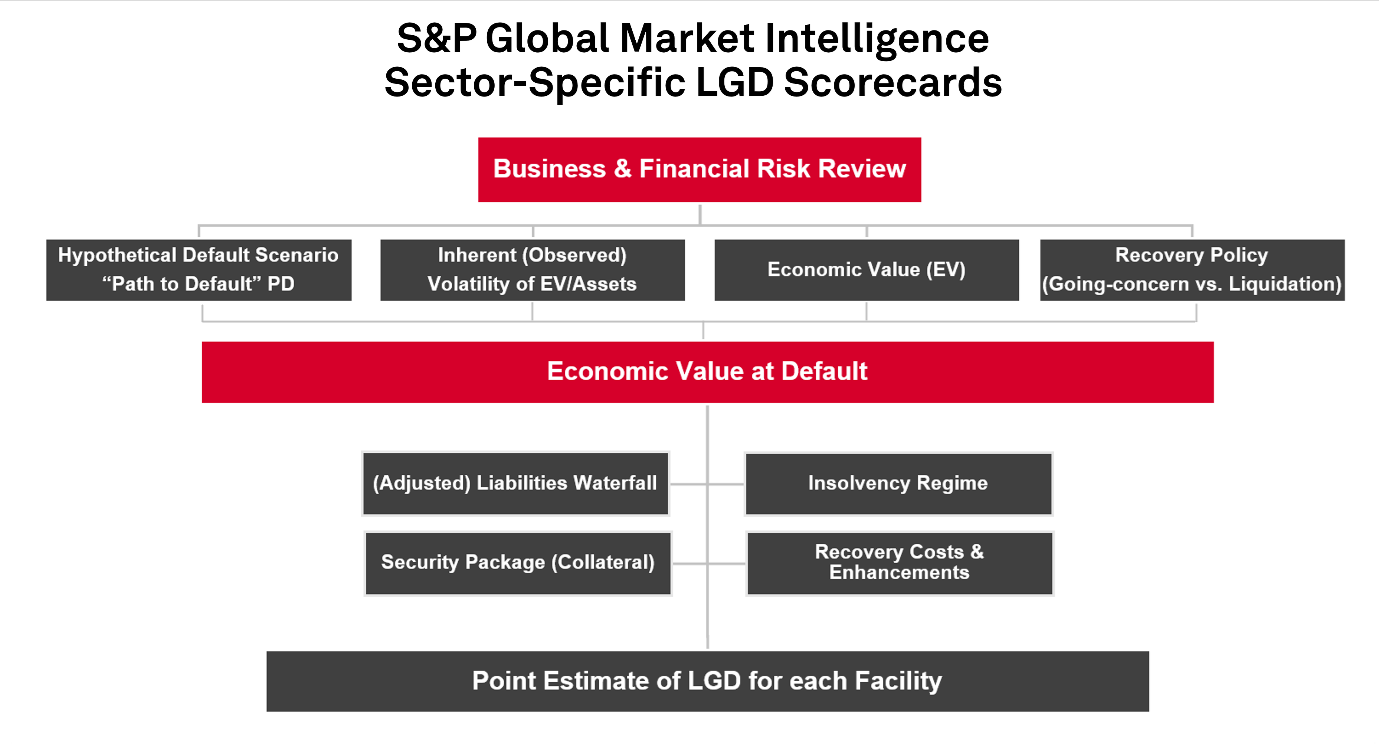
Our LGD scorecards were constructed over 25 years ago to estimate LGD at the facility level exposures. We believe that LGD should be conditional on explanatory variables and exposure specifics, resulting in a more reliable facility- or bond-specific PiT estimate of loss for any exposure, secured or unsecured. To achieve this, we undertook extensive research to identify possible explanatory variables, placing equal emphasis on both qualitative and quantitative factors. We identified six drivers of loss:
- Pre- and post-default quantity and riskiness of cash flow/assets/economic value
- The seniority of exposure (e.g., a senior bond)
- Jurisdiction
- Economic expectations
- Collateral and guarantees/insurance
- Recovery costs and workout policy (restructuring versus disposal)
These factors were further refined for sovereign-specific elements, including post-default expectations of support (e.g., bilateral or multilateral), expectations of post-default economic/political stability, and historical default experience. The final Scorecard inputs – which include a combination of macroeconomic, fiscal, and market indicators – were selected based on the ease of availability of forecast data.
Figure 5 S&P Global Market Intelligence LGD scorecard framework
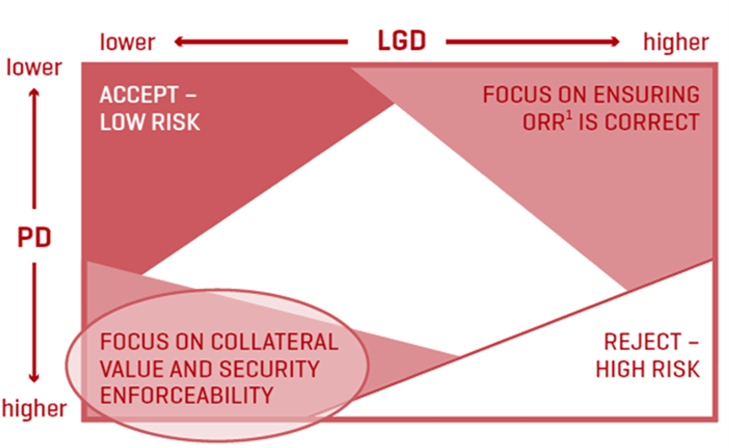
The S&P Global Market Intelligence LGD scorecards solutions help the institutions to separate the two credit risk dimensions – probability of default (PD) and recovery risk – enabling users to both analyse and manage distinct risks in different ways.
Figure 6: managing credit risk on both dimensions given the continuous nature of PD and recoveries
Click Here for more information on our LGD Scorecards.
What to watch for going in the next quarter
- Shift in the LGD bucket distribution (is the market moving toward high loss severity?)
- Changes in the high-LGD tail (new entities entering the 70-90 or 90-100 buckets)
- Sector rotation effects (e.g., more discretionary services vs materials/resources)
- Mean-median divergence as quick gauge of tail heaviness
This article was published by S&P Global Market Intelligence and not by S&P Global Ratings, which is a separately managed division of S&P Global.
1 CreditModel outputs are not S&P Global Ratings’ credit ratings and are not a substitute. Lowercase nomenclature is used to differentiate S&P Global Market Intelligence CreditModel scores from the credit ratings issued by S&P Global Ratings.
Location
Products & Offerings