


Research — January 12, 2026
Visible Alpha breakdown of US airlines’ fourth-quarter earnings expectations
By Mrunalini Mandore, Neha Jain, and Zulekha Manee
US airlines will kick off fourth quarter earnings season on Tuesday, January 13, with Delta reporting first, followed by peers through to Southwest on Friday, January 30. Visible Alpha consensus estimates point to mixed earnings expectations, as steady travel demand is offset by weaker pricing, rising costs, and temporary operational disruptions linked to the recent US government shutdown.
Delta Air Lines Inc. (NYSE: DAL) and United Airlines Holdings Inc. (NASDAQ: UAL) are the first to report earnings next week. Analysts expect Delta to deliver modest revenue growth of 1.4% year-on-year, while United is projected to see a stronger growth of 4.9%, driven by higher capacity and resilient traffic. However, lower revenue per mile and rising unit costs are expected to pressure margins, with Delta’s EBITDAR expected to be down 5.1% and United’s down 3.8%.
American Airlines Group Inc. (NASDAQ: AAL), reporting later in the month, is expected to see a 3.2% revenue growth in Q4, though profitability is likely to remain constrained.
Low-cost carrier, Southwest Airlines Co. (NYSE: LUV) is expected to deliver strong traffic and revenue growth, although profitability is forecast to weaken, with net income projected to fall 18%. Alaska Air Group Inc. (NYSE: ALK) is forecast to see low margins, minimal net income, and heavy EPS decline, despite a modest increase in revenue. JetBlue Airways Corp. (NASDAQ: JBLU) remains in the red, with analysts expecting another quarterly loss amid pricing pressure and capacity discipline.
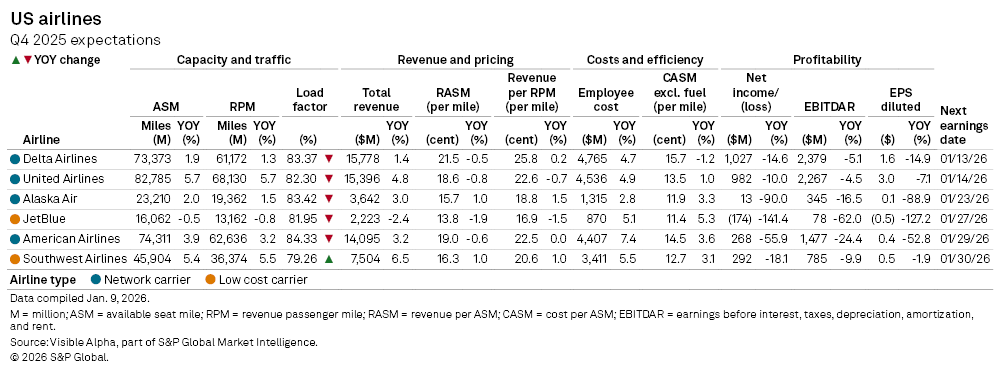
Overall, as in the third quarter, profitability across airlines remains under pressure. Revenue growth is being driven largely by higher volumes rather than pricing power, while rising labor and operating costs continue to constrain margins.
Capacity and traffic:
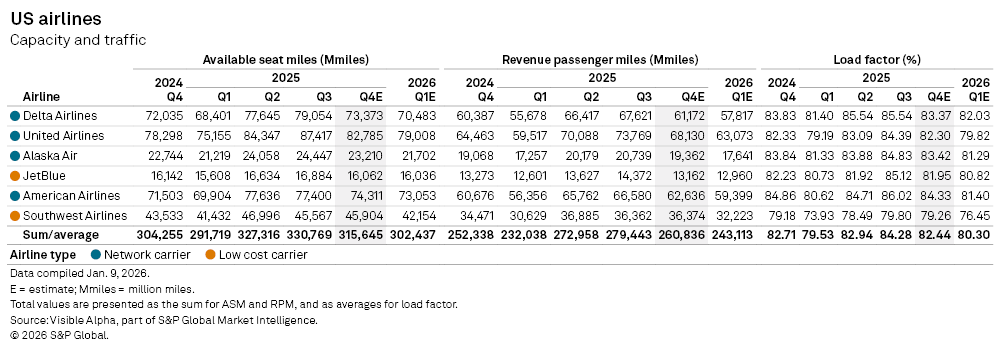
Capacity and traffic expectations for US airlines in Q4 2025 point to continued, but measured, growth, with total available seat miles (ASM) across the group projected at 315.6 billion, up 3.7% from 304.3 billion in Q4 2024, while total revenue passenger miles (RPM) are expected to rise to 260.8 billion, up 3.4% from 252.3 billion a year earlier.
Network carriers continue to lead expansion, with United Airlines increasing capacity from 78.3 billion ASM in Q4 2024 to 82.8 billion in Q4 2025 (+5.7% YOY), alongside a rise in RPM to 68.2 billion (+5.7% YOY). Delta Air Lines shows more modest growth, with ASM rising to 73.4 billion (+1.9% YOY) and RPM to 61.2 billion (+1.3% YOY).
Among other carriers, JetBlue is projected to see slightly lower ASM (-0.5% YOY) and RPM (-0.8% YOY), while Southwest Airlines expectations seem relatively strong with ASM up 5.4% year-on-year and RPM up 5.5%, compared to last year.
Load factor remains high across the group, averaging 82.4% in Q4 2025, though slightly below the 82.7% recorded a year earlier. This reflects strong underlying demand but also suggests that capacity growth is marginally outpacing traffic, resulting in slightly less efficient seat utilization.
Revenue and pricing:
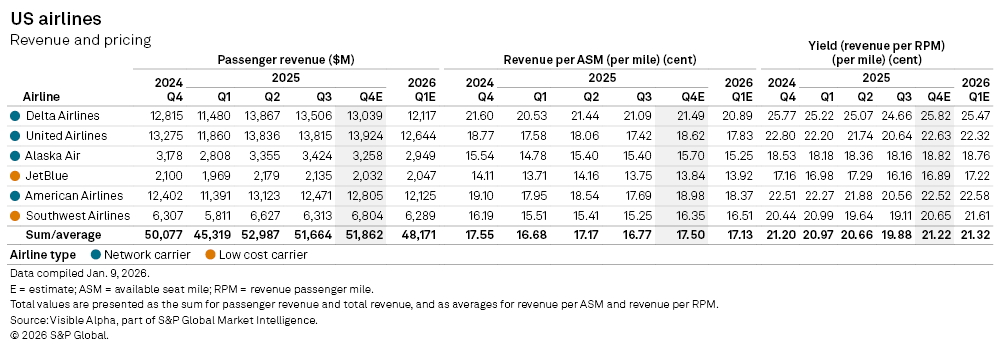
Revenue and pricing expectations for Q4 2025 point to a resilient topline but continued pressure on unit revenues. Total passenger revenue for the group is projected at $51.9 billion, up 3.6% from $50.1 billion in Q4 2024.
Legacy carriers continue to dominate revenue generation, while Southwest expectation shows the strongest growth in passenger revenue, rising to $6.8 billion (+7.9% YOY). JetBlue is the only outlier, with passenger revenues projected to decline 3.3% year-on-year to $2 billion.
Despite higher revenues, revenue per available seat mile (RASM) remains broadly flat to slightly down for most carriers, due to weaker pricing power. Group-average RASM is expected to edge down marginally to 17.50¢ in Q4 2025 from 17.55¢ a year earlier.
Yield trends tell a similar story. Average yield across the group is projected at 21.22¢ in Q4 2025, broadly in line with last year, but still below mid-2024 peaks. Delta is expected to maintain the highest yield at 25.82¢, benefiting from its premium-heavy network, while analysts see United and JetBlue yield fall year-on-year.
Cost and efficiency:
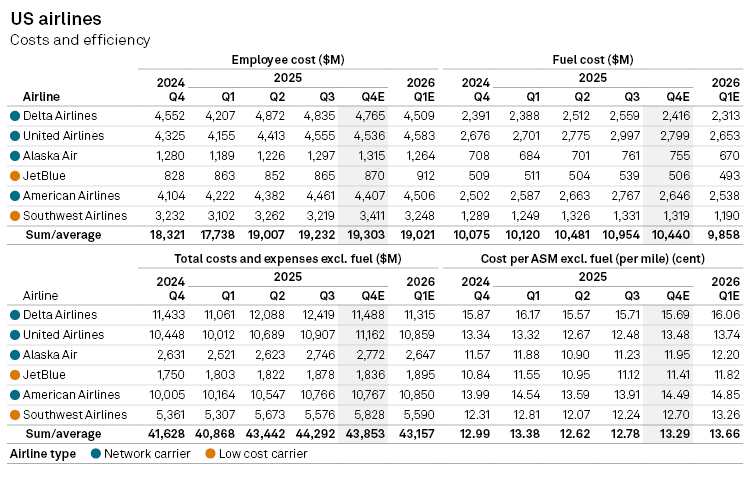
Cost and efficiency metrics for Q4 2025 point to persistent margin pressure across US airlines, as rising labor costs outweigh some moderation in fuel expenses. Employee costs are rising across all carriers, with total employee costs for the group are expected to increase to $19.3 billion, up 5.4% from $18.3 billion in Q4 2024, reflecting higher wages, contractual pay rises and elevated staffing levels following strong operational demand through 2025.
Overall, total expenses excluding fuel are projected to rise 5.3% to $43.9 billion in Q4 2025 from a year earlier. On a unit basis, cost per available seat mile (CASM) excluding fuel is projected to increase 2.3% year-on-year to 13.29¢, compared with 12.99¢ a year earlier.
Profitability:
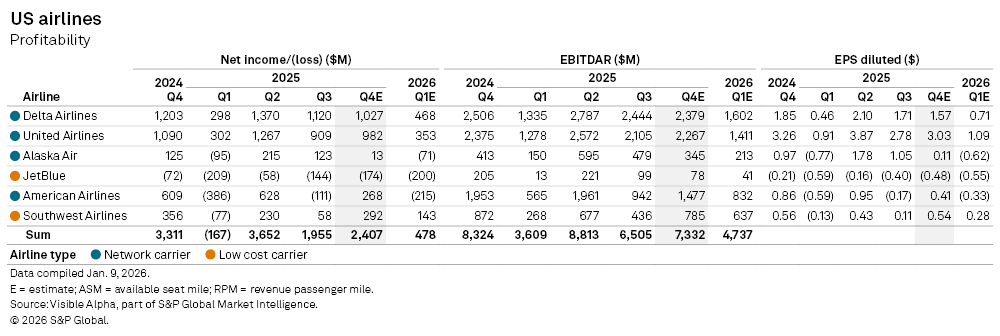
Profitability across US airlines is expected to remain under pressure in Q4 2025, with net income declining for most carriers compared with Q4 2024, reflecting weaker pricing, higher costs and limited operating leverage. Aggregate net income for the group is forecast at $2.4 billion, down from $3.3 billion a year earlier.
EBITDAR trends reinforce the picture of margin compression. Meanwhile, diluted EPS is expected to moderate across the board, signaling that earnings growth is constrained by rising labor and fuel costs, as well as competitive pricing pressures.
Overall, US airlines are poised for moderate and uneven earnings. While passenger demand and travel volumes remain robust, the industry continues to grapple with higher labor costs, limited pricing power, and impact from the temporary disruption of the US government shutdown.
This article was published by Visible Alpha, part of S&P Global Market Intelligence and not by S&P Global Ratings, which is a separately managed division of S&P Global.
Content Type
Theme
Products & Offerings
Segment
