


BLOG — Nov 6, 2025
Navigating the Storm in the Corporate Bond Market: A Methodical Approach to Liquidity Stress Testing

In the rapidly evolving financial landscape, risk and investment professionals are increasingly alert to a potential downturn in the corporate bond market, particularly as a result of the fallout from U.S. tariffs. Recent months have seen a marked decline in the industrial output of German manufacturing companies, raising alarms about the potential deterioration of their debt quality. While the pronounced drop in orders and intensified competition from China primarily impacts the German industry, many other European and U.S. firms are likely to experience lower earnings as the long-term repercussions of these tariffs unfold.
The anticipated volatility in credit markets may not only erode the value of corporate bonds and loans but could also lead investors to swiftly withdraw their funds from fixed-income portfolios, resulting in considerable liquidation costs in addition to the already incurred losses. In this scenario, risk and portfolio managers must ensure that a substantial portion of their bond holdings can be liquidated quickly at minimal cost, all while adhering to their long-term investment strategies.
A particularly challenging aspect of this task is the accurate assessment of liquidity risk, which has traditionally depended on both historical and hypothetical scenarios. However, these methodologies are often limited by insufficient historical data, the maturation of financial instruments, oversimplifications, and the reality that past events rarely unfold in a similar manner.
To overcome these challenges, implementing a market-implied liquidity scenario offers a more robust solution. This approach not only connects liquidity scenarios to high-volatility events in the financial markets but also facilitates the sophisticated calibration of liquidity parameter shocks by gleaning behavioral patterns from historical data.
Calibration of Liquidity Parameter Shocks
The primary challenge of liquidity stress testing lies in accurately predicting shocks that correspond with the anticipated state of financial markets. In market-implied scenarios for fixed income instruments, this is achieved by capturing the historical relationship between the rise of credit protection costs and the concurrent changes in bond liquidity parameters, such as bid-ask spreads, quote ranges, and quote volumes. These three parameters are calculated by S&P for hundreds of thousands of individual bonds, utilizing order book records gathered from dealers in the OTC markets. Figure 1 displays representative bid and ask quote volume structures estimated from the available market data and illustrates how the parameters alter in response to a sudden liquidity crunch.
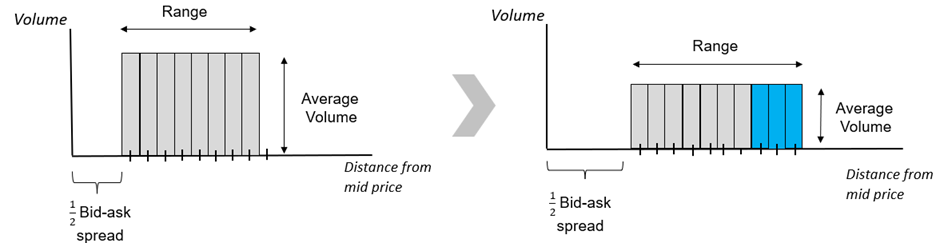
Figure 1: Shift of the quote volume structure under stress scenario. The volume structure is a construct that describes the available quote prices and volumes that are readily available to be liquidated through a sale. Our model assumes an average uniform volume per quote (i.e. a rectangular structure). Note that the bid-ask spread and bid range increase while the bid volume shrinks.
The initial step in the shock calibration process involves a comprehensive analysis of historical credit market dynamics, focusing on the spread evolution of liquid issuers within the CDS market. The CDX North America HY and iTraxx Crossover indices serve as reliable barometers for the American and European high-yield sectors, while the CDX North America IG and iTraxx Europe IG indices lend themselves to tracking investment-grade credit. The strong correlations between these indices during periods of high credit volatility allow for the consolidation of their constituents into a sample of 425 equally weighted reference bonds. Historical data reveal that over the past eight years, credit spreads have widened materially on numerous occasions, each time correlating with significant economic or geopolitical events.
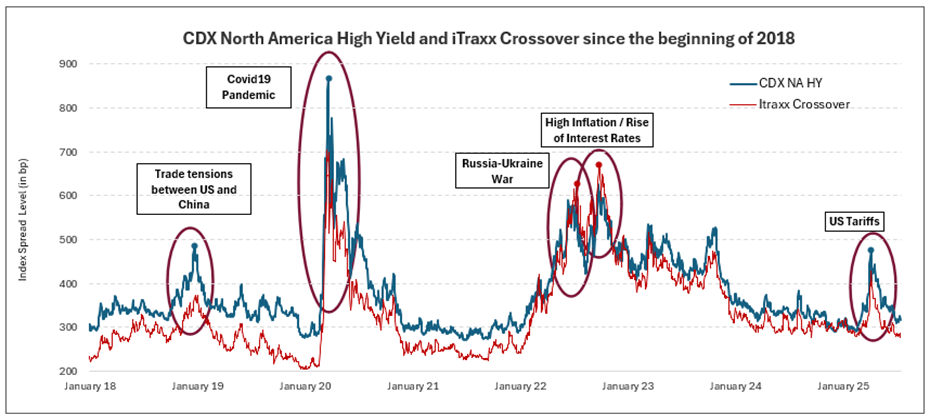
Figure 2: Co-movement of the CDX North America HY and iTraxx Crossover indices.
Recognizing that liquidity tends to decrease during periods of soaring credit protection costs, we begin with the search for the highest index value within each high-spread regime and then trace back to locate the data points specified by standardized spread increments, such as 50bp, 100bp, 150bp, etc. This approach enables us to explore how liquidity parameters have reacted to the standardized increase of the index spread level and allows for aggregating the changes of parameter values across various regimes.
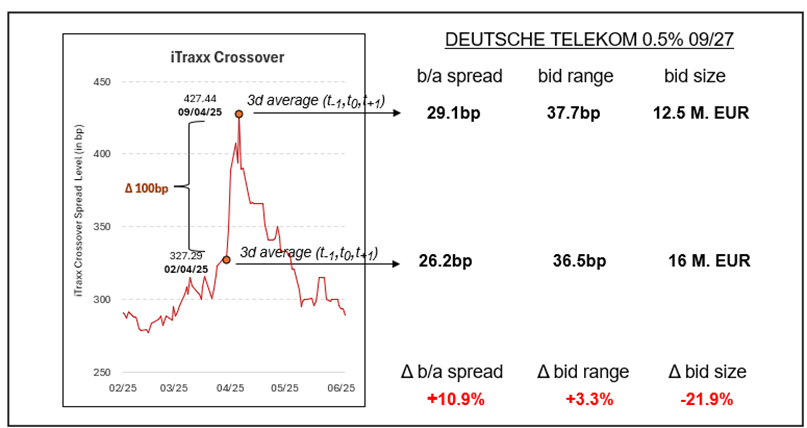
Figure 3: Estimation of liquidity parameter changes for a Deutsche Telekom bond in response to 100bp spread widening after the announcement of the US tariffs in early 2025. A three-day average is used to avoid data gaps during local public holidays. Note that only the bidding quotes are used in the estimation process as the focus is on asset liquidation only.
After estimating the historical parameter changes for all bonds in the sample by replicating the methodology shown in Figure 3, the next step is to calibrate the magnitude of the shocks. This entails the formation of consistent peer groups based on bond characteristics, with the aim of generating proxy values for securities that may not be directly represented within the estimation universe. For each industry sector in Europe and North America, distinct groups are established for investment-grade and non-investment-grade (i.e., high-yield and other speculative) bonds. Following this step, average parameter changes are calculated within each peer group, a stratification that effectively reduces complexity and enhances the reliability of the forecast.
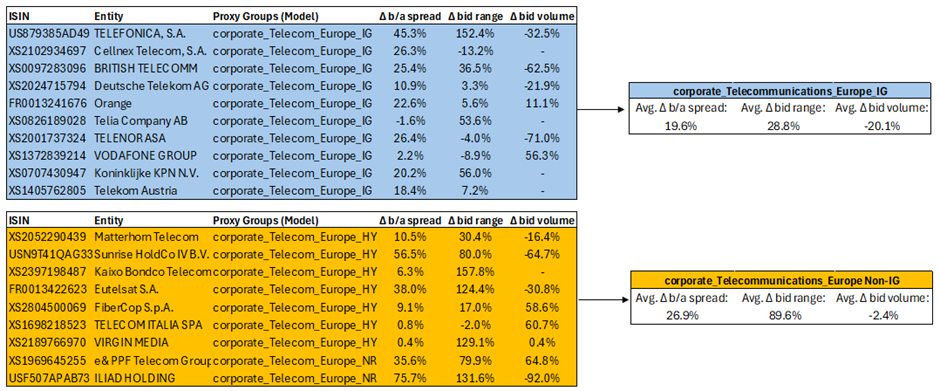
Figure 4: Estimation of liquidity parameter changes for peer groups in the European telecommunication sector
The final step in the calibration process involves aggregating the estimated parameter shifts across multiple high-spread regimes. While a variety of weighting options exist, the chosen method applies weights based on the number of bonds within each peer group across different regimes. Utilizing peer groups rather than individual bonds in the aggregation process proves advantageous, as it mitigates challenges stemming from the maturation of bonds and periodic modification of index constituents.
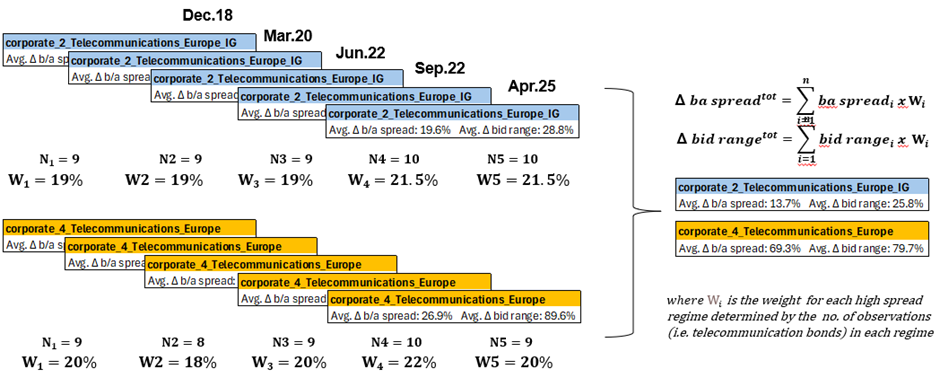
Figure 5: Aggregation of the estimated liquidity parameter shifts across different high-spread regimes for peer groups in the European telecommunication sector. Bid volume follows the same aggregation method as bid ask spread and bid range.
The outlined calibration process needs to be repeated for a total of 40 peer groups (2 regions x 10 sectors x 2 credit quality grades). Such granularity can be feasibly implemented within a diversified hypothetical stress test while adequately accounting for the characteristics of individual bonds. Empirical results from data analysis since the beginning of 2018 indicate that liquidity parameters exhibit significant variation in response to rising costs of credit protection, contingent upon the bond peer groups. Figure 6 compares the average bid-ask spread changes for investment-grade and non-investment-grade bond groups in Europe and North America, assuming a sudden 100bp widening of high-yield credit index spread. The estimated values demonstrate considerable variation across regions, investment grades, and industries, underscoring the inadequacy of a “one size fits all” approach in conventional hypothetical stress testing. Moreover, similarly substantial dispersions can be observed in the quote size and quote volume parameters.
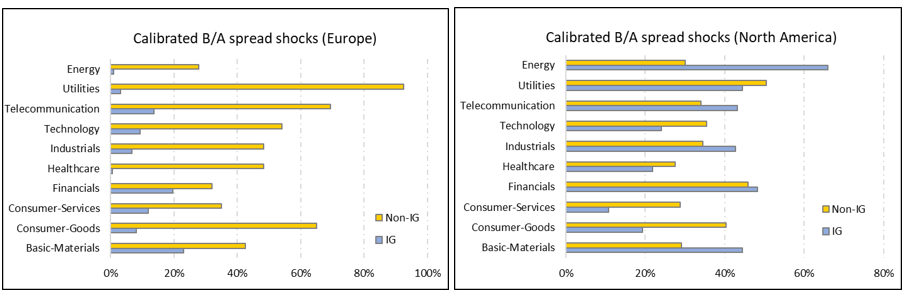
Figure 6: Empirically calibrated (half) bid-ask spread shocks for the bond peer groups in response to 100bp HY credit spread widening. The data is obtained from the high spread regimes identified since the beginning of 2018.
Stress Testing Liquidity of a diversified Corporate Bond Portfolio
With the methodology established, we can set about applying the calibrated liquidity shocks to a real-world bond portfolio. For the sake of brevity, we assume that spreads widen uniformly by 100bp across all high-yield credit markets, even though the calibration model allows for adopting more sophisticated scenarios, such as a 100bp widening in Europe and a 150bp widening in North America.
Since distressed markets and increased investment withdrawals are not independent and usually occur at the same time, the stress test should answer the question of how quickly and at what cost a portfolio of bonds can be converted to cash. Considering the previously outlined assumptions on the bid/ask size structure, a trading strategy involving sequences of quote volume liquidations across the prices and days has been developed and integrated into the S&P liquidity model. The key analytical outputs derived from this model are:
- Time to liquidation (TTL), indicating the duration required to fully liquidate the specified bond volume.
- Cost to liquidation (CTL), indicating the total costs incurred during the liquidation process, as measured against the mid-price and weighted by volume.
These two measures of liquidity can be applied to quantify the impact of a stress scenario on bond investments. Neither metric is superior to the other as they are both important for liquidity risk assessment.
Our sample portfolio, comprising 25 corporate bonds, is relatively liquid, capable of conversion to cash within two days. The results shown in Figure 7 were obtained under the assumption of the waterfall strategy, which is designed to sell the most liquid assets first. However, the stress scenario unveils concerning results: after shifting the liquidity parameters using the calibrated shocks, the time required to liquidate the portfolio holdings has significantly increased, while transaction costs of this operation have escalated, revealing vulnerabilities that might have been previously overlooked.
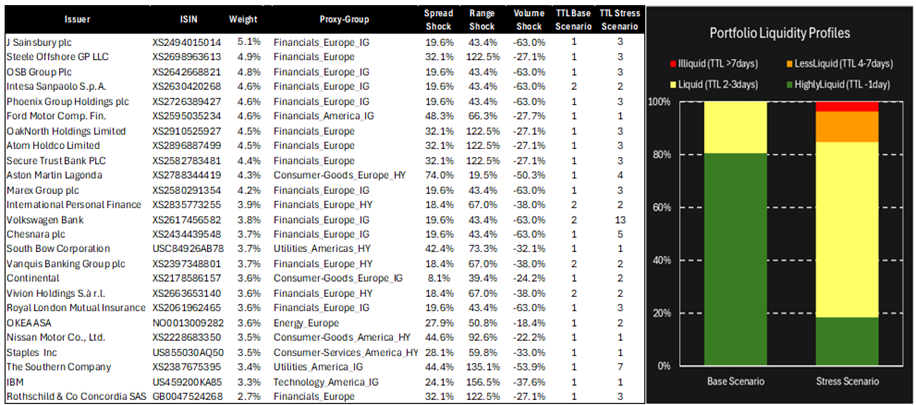
Figure 7: Portfolio overview and its liquidity profiles under the base and stress scenarios. The shocks are calibrated with the liquidity data recorded during credit spread widenings in 2020 and 2025. Analysis date: 29. Aug. 2025
The first red flag is the share of illiquid and less liquid holdings in the portfolio under the stress scenario. Bonds issued by VW Bank, Chesnara, The Southern Company, and Aston Martin Lagonda may become hard to liquidate if the high-yield credit spreads widen by just 100bp. Equally awkward would be the increased cost of turning the portfolio into cash under time pressure. Figure 8 shows how the cost of liquidation would change for the most vulnerable holdings.
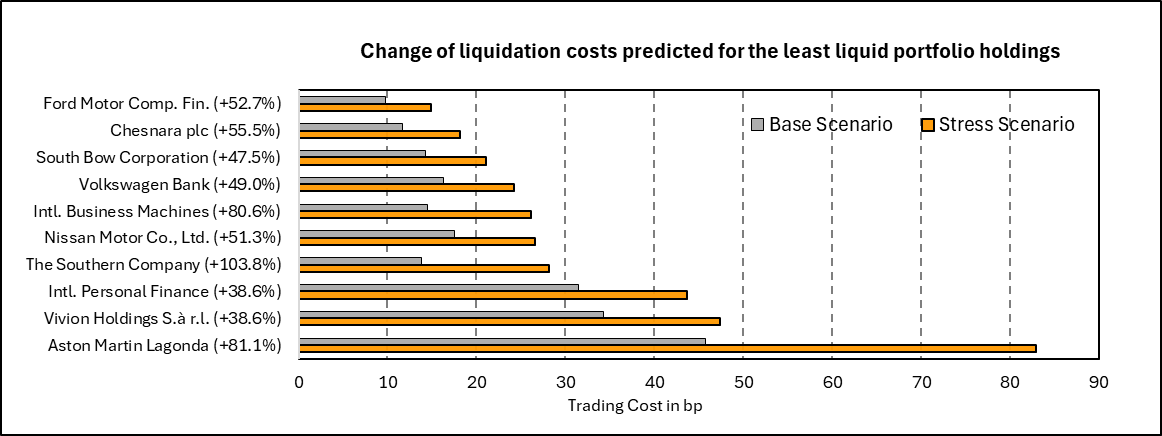
Figure 8: Increase of liquidation cost in response to a 100bp HY credit spread widening
The obtained results emphasize the critical importance of understanding how distressed credit markets affect the liquidity of fixed income assets. That said, it is essential to acknowledge that a 100bp increase in credit protection costs would, in practice, unlikely lead to the liquidation of an entire portfolio. Such an extreme investment withdrawal typically requires a sustained period of aggressive credit spread widening, similar to the conditions observed during the Global Financial Crisis in 2008 or at the onset of the COVID-19 pandemic in early 2020. Nevertheless, scenarios that anticipate even a moderate increase in credit protection costs can be effectively leveraged to develop risk mitigation strategies, such as diversifying holdings and adjusting liquidity profiles
Conclusion
Warren Buffett once wisely said "Risk comes from not knowing what you’re doing,” and we could not agree more with his statement when it comes to building liquidity scenarios. Understanding the relationship between shocks to market risk factors and their impact on liquidity parameters is a challenging exercise but is the key to pinpointing vulnerabilities of portfolios in case of a sudden, crunch driven capital outflow.
By constructing market-implied stress tests informed by empirically calibrated shocks, risk and investment professionals can significantly improve their insights into potential threats to the liquidity of a wide range of financial instruments. After all, the outlined approach can be effectively applied not only to corporate bonds but also to loans, securitized products and sovereign debt.
With sharp market expectations, robust analytical software, and a touch of innovation, it is possible to navigate the complexities of liquidity risk in distressed markets more adeptly than ever before. As we stand on the brink of potential upheaval in the bond markets, we encourage everyone to embrace this methodology and explore its transformative potential.
As we navigate the complexities of the corporate bond market, the importance of robust financial risk analytics cannot be overstated. We invite you to explore our comprehensive financial risk analytics solutions on our website. These tools are designed to equip you with the insights necessary to identify, assess, and mitigate potential risks in your investment strategies. Enhance your decision-making capabilities and position yourself for success in today’s dynamic financial environment.