


Research — Sept. 4, 2025
US P&C insurers approached peak profitability in stellar Q2

By Tim Zawacki
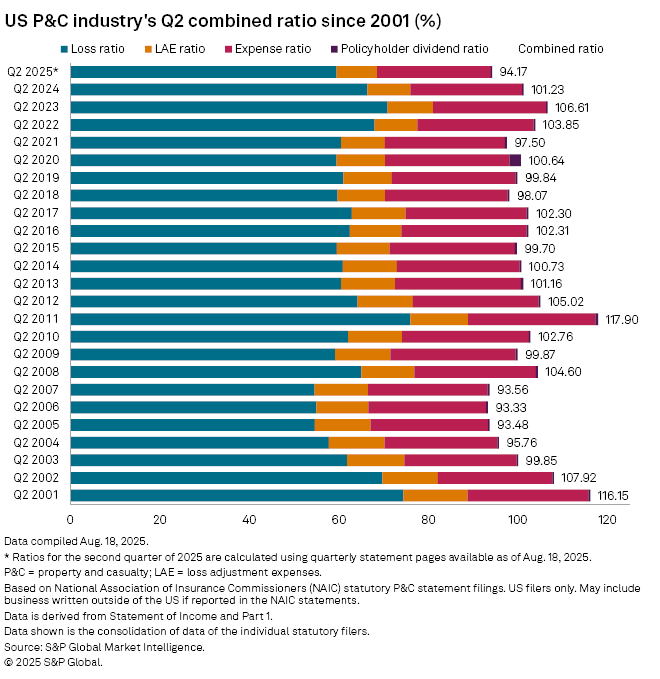
The combination of below-average catastrophe losses and superb performance in the largest business line during the three-month period ended June 30 led the US property and casualty industry to post its lowest statutory combined ratio in a second quarter in 18 years.

Our analysis of statutory financials of more than 2,500 individual P&C entities, which were posted Aug. 19 on S&P Capital IQ Pro, finds the industry produced a combined ratio of less than 94.2% in the second quarter, down from 101.2% in the year-earlier period. The net underwriting profit of $12.89 billion marked a swing of more than $18 billion from the loss recorded in the second quarter of 2024. It ranks as the second-largest net underwriting profit recorded by the US P&C industry on a nominal basis since at least the start of 2001, surpassed only by the $20.73 billion produced in the fourth quarter of 2024. For a second quarter, the result exceeds the previous 21st-century high-water mark of $6.94 billion in 2006, or approximately $11.03 billion on an inflation-adjusted basis.
The personal lines led the way, demonstrating the success of the numerous corrective actions that have carriers employed to combat surging loss-cost inflation in the aftermath of the COVD-19 pandemic and to refine their risk appetites following several years of heavy losses from natural catastrophes. A combination of timing and good fortune also played to the industry's benefit as our analysis of the data shows a muted impact from catastrophes and little discernible effects of the evolving US tariff policy. The highest amount of favorable prior-year loss and loss adjustment expense reserve development in a second quarter in more than a decade at $3.22 billion also made a meaningful contribution to the improvement.
Given the strength of underlying fundamentals in key business lines and the resilience of the US economy, the industry is well-positioned for the near- and intermediate terms even as some lines show signs of strain, growth rates retreat and hurricane season ramps up.

As good as it gets?
The residential and commercial property, inland marine, private auto and workers' compensation lines, which combine to account for more than 70% of the US P&C industry's direct premiums earned, all delivered historically favorable results in the second quarters. This put the industry on the fast track to standout results even as the remaining 30% of the sector showed evidence of fundamental weakness.
Our review of disclosures on Part 1 of quarterly statements finds that the direct incurred loss ratios in the homeowners, allied lines and non-liability portion of the commercial multiperil business tumbled by 22.4, 10.1 and 9.6 percentage points, respectively. The result of 57.8% in the homeowners business was more than 2 percentage points lower than any second-quarter direct incurred loss ratio for the line since 2007. It followed a first quarter when the industry posted its highest homeowners direct incurred loss ratio in an opening quarter of a year in at least 25 years owing to billions of dollars in catastrophe losses from January's wildfires in Los Angeles County, Calif.
While there are no fields in statutory financial reports for catastrophe losses, we used Visible Alpha to pull actual and estimated catastrophe loss ratios for 2021 through 2027 for a selection of 25 publicly traded P&C insurers. We then calculated quarterly median cat loss ratios to assess how the second quarter of 2025 compares to actual results for the previous four second quarters and to sell-side equity analysts' estimates for the second quarters of 2026 and 2027. We found that the median cat loss ratio of 3.35% was the lowest such second-quarter result for the 25-company cohort in four years, and it was 1.05 percentage points below the median estimate for the second quarter of 2026.
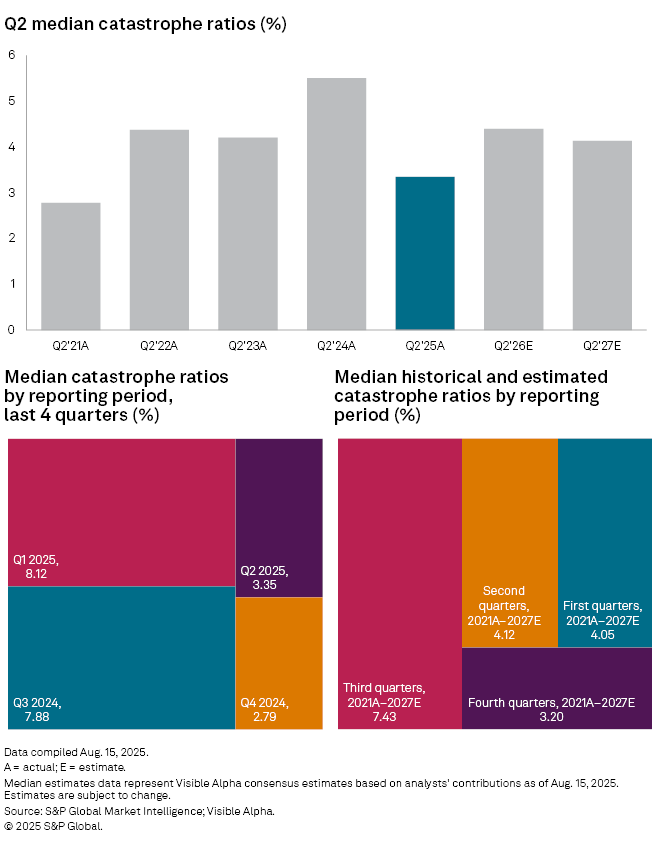
It comes as no surprise that the third quarter ranks as the most active period for catastrophes given the significance of landfall-making hurricanes during that timeframe. The median Visible Alpha actual and estimated cat loss ratios for the third quarters of 2021 through 2027 is 7.43%, 3.31 percentage points higher than the median for the second quarter, which is usually driven by the frequency and severity of severe convective storms. Notably, the first-quarter cat loss ratio in 2025 was 8.12% due to the significant impact of the Los Angeles wildfires.
But relatively benign catastrophe losses do not solely explain the industry's significant outperformance, particularly in the homeowners business. After all, the homeowners direct incurred loss ratio in the second quarter of 2025 was more than 8 percentage points lower than in the second quarter of 2021 when the Visible Alpha data suggests the impact of catastrophes was incrementally lesser. Steps taken by carriers such as multiple rounds of rate increases across most states, increased risk-sharing with policyholders in areas prone to losses due to wind and hail, and comprehensive re-underwriting of books of business to mitigate risk through nonrenewals and repricing are clearly beginning to bear fruit.
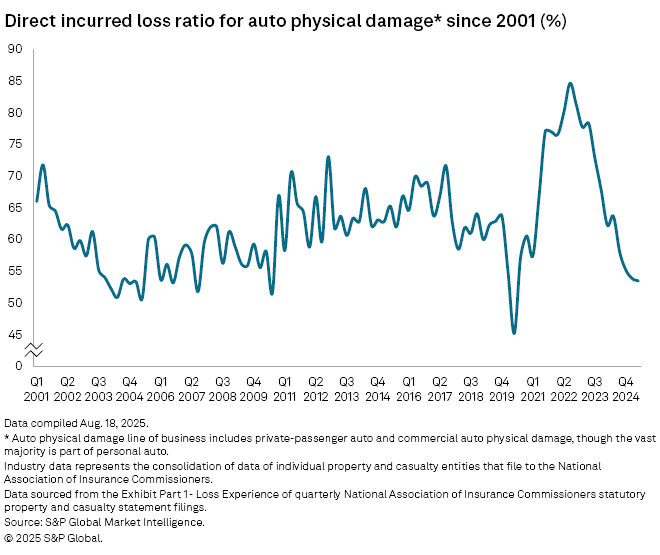
The private auto business has similarly benefited from significant tailwinds on both the top and bottom lines. The second-quarter private auto direct incurred loss ratio of 60.8% represented a decline of 7.3 percentage points from the year-earlier period. It stands as the lowest such result in any quarter since the first quarter of 2021 when claims frequency remained depressed due to pandemic-related effects. Note that for the purposes of providing comparisons over a longer time frame, we include commercial auto physical damage results in the aforementioned loss ratios. When excluding that coverage, the ratio would have been approximately 0.3 percentage points higher.
Excluding the pandemic, the private auto loss ratio has already fallen below the minimum level achieved in the late 2010s as the industry was emerging from the previous cycle. It was consistently in the high-50s in 2004.
Notably, the private auto physical damage direct incurred loss ratio did not show any discernible impact from US tariff policy, which threatens to trigger inflation in the cost to repair and replace damaged vehicles. The result of 53.9% marked declines of 9.8 percentage points year-over-year and 1.6 points from the first quarter.
With results having improved dramatically, we continue to see carriers dial down the rate increases that had become commonplace during the past three years. In turn, the private auto direct premiums written growth rate fell to 3.8% in the second quarter, the smallest rise since the first quarter of 2022.
Casualty struggles continue
Exceptional results in the property lines and private auto business partially mask the ongoing challenges the industry is confronting in the casualty lines where social inflation continues to simmer.
The direct incurred loss ratio in the other liability-occurrence line worsened to 73.3% in the second quarter from 71.9% in the year-earlier period. When combining all of the other and product liability lines together, the direct incurred loss ratio deteriorated to 66.0% from 64.9%. CNA Financial Corporation's Continental Casualty Co. posted a net underwriting loss of $276.0 million in the quarter, inclusive of adverse prior-year reserve development of $174.2 million. Of that amount, $133.9 million was attributable to the other liability-occurrence line where Continental Casualty said the development was largely associated with legacy mass tort abuse claim activity.
The commercial auto liability business, another notorious trouble spot for the industry, appeared to show improvement on a year-over-year basis, with the direct incurred loss ratio falling to 74.2% from 82.1% in the year-earlier period. The decline was partially illusory, however, as a reserving methodology change at New York livery insurer American Transit Insurance Co. inflated the second-quarter 2024 result by 4.5 percentage points. The first-quarter 2025 commercial auto liability loss ratio was nearly 6.3 percentage points lower. The commercial auto liability direct incurred loss ratio has exceeded 70% for 11 consecutive non-first-quarter reporting periods.
Sharing the wealth
A total of 27 US P&C groups and stand-alone entities generated net underwriting gains of $100 million or more in the second quarter with The Progressive Corp., Berkshire Hathaway Inc. and Liberty Mutual Holding Co. Inc. each producing underwriting profits in excess of $1 billion. The underwriting results for Progressive, Liberty Mutual, The Travelers Cos. Inc., The Allstate Corp. and the group led by State Farm Mutual Automobile Insurance Co. improved by more than $1 billion on a year-over-year basis, with State Farm's profit of $387.0 million representing an improvement of $4.74 billion. Each of the groups ranks among the nation's leading private auto insurers and all but Berkshire, parent of Geico Corp., are significant writers of homeowners business.
But a large personal lines emphasis did not guarantee success in the second quarter. The group led by Erie Insurance Exchange, which generates a majority of its business from the private auto and homeowners lines, was one of five P&C groups to produce net underwriting losses of more than $100 million, joined by CNA, the US subsidiaries of PartnerRe Ltd. and QBE Insurance Group Ltd., and the group led by Shelter Mutual Insurance Co. Exchange attorney-in-fact Erie Indemnity Company reported that catastrophes contributed 64 percentage points to the group's homeowners statutory combined ratio of 136.9% in the second quarter; its private auto statutory combined ratio improved by 7.5 points year-over-year, but remained elevated at 110.6%.
Methodology
The industry-level results for the second quarter of 2025 referenced in this article represent an aggregation of individual company results filed with the National Association of Insurance Commissioners and obtained by Market Intelligence as of Aug. 18; prior-period results reflect our previously published aggregations of total-filed results. Any group-level results referenced in this article for the first quarter of 2025 reflect manual compilations of as-reported individual entity data.
Our second-quarter 2025 calculations also may incorporate data for recently formed entities that may not immediately be available on S&P Capital IQ Pro. Quarterly results for New Jersey-domiciled entities are unavailable due to a state statute that deems those filings to be confidential and not subject to public inspection.
While the first-quarter data will change to some extent as we obtain additional information in the coming weeks, we do not anticipate the movement will be material based on the number and relative magnitude of the expected filers for which we have not received results.
Important considerations for our combined ratio calculations include the following: the results include policyholder dividends unless otherwise noted, and we base expense ratios as the combination of other underwriting expenses and aggregate write-ins for underwriting deductions as a percentage of net premiums written.
For more information on Visible Alpha's P&C industry coverage, please click here. Visible Alpha is part of S&P Global Market Intelligence.
This article was published by S&P Global Market Intelligence and not by S&P Global Ratings, which is a separately managed division of S&P Global.