17 Jul, 2025
Personal lines insurers rise in 2024 US P&C performance rankings
Personal lines insurers made headway in S&P Global Market Intelligence's US property and casualty industry performance rankings based on 2024 statutory financial results, fueled by premium growth above that of the largest commercial and reinsurance companies.
Despite the improvement in personal lines, commercial insurers still generally fared better than personal lines companies and the three top performers in the study were commercial companies.
- Access the performance rankings for the top P&C insurers in the analysis.
- Access our interactive US P&C insurance performance ranking template.

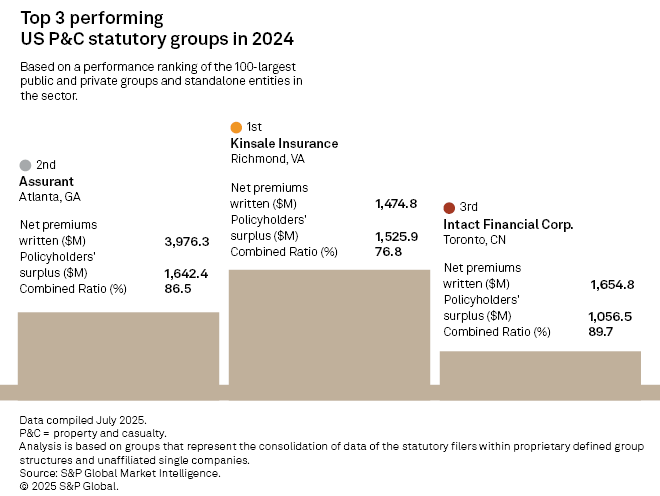
For the third straight year, Kinsale Capital Group Inc. topped the S&P Global Market Intelligence insurance performance rankings of the 100 largest P&C insurance companies. Kinsale's strongest metrics in the performance rankings were related to asset and surplus growth and returns. Kinsale grew assets and surplus each in excess of 30% for the year. Kinsale also experienced a return on average assets at 12.17% and return on equity of 35.35%. All of these figures rank among the highest included in the study.
The second and third highest-ranking companies — Assurant Inc. and Intact Financial Corp. — were also commercial insurers. The ranking for these two companies was also bolstered by strong returns on assets and equity. Assurant's return on assets for the year was 10.16% and return on equity was 46.54%, while Intact recorded return on assets of 7.29% and return on equity of 34.00%.
Overall, commercial insurers generally performed better than personal lines insurers. Commercial carriers made up 56% of the largest 100 companies reviewed, but 76% of the top 50 companies ranked by performance.
Though still lower in the rankings, personal lines companies' performance improved in 2024. In 2023, personal lines companies made up only three of the top 50 performing companies while in 2024, that number increased to 12. Four of these companies placed in the top 10: The Progressive Corp., American Family Insurance Group, Mercury General Corp. and Berkshire Hathaway Inc.
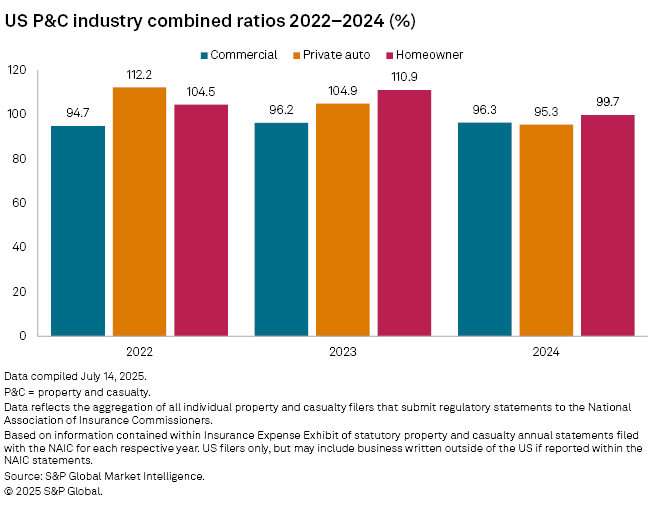
The personal lines bounce-back was fueled by rising premiums. The personal auto business thrived, but homeowners improved as well in 2024. Premium growth fueled by substantial rate increases greatly outpaced loss growth for both lines of business. Private auto net premiums written rose by 12.8% while net incurred losses remained relatively flat, with growth of only 0.2% in 2024. Meanwhile, homeowners net premiums written increased 13.8% while losses dropped by 2.2%. These premium increases have rekindled profitability for both lines of business. Combined ratios for personal auto and homeowners on a net basis, after consideration of reinsurance in 2024 were 95.3% and 99.7% respectively after a period of ratios well over 100%.
Methodology
To determine the performance scores of the individual P&C groups, we calculated the mean results for each of the 13 performance metrics and then determined each company's deviation from those means. The deviation from the mean was standardized so the different metrics chosen could be compared. To minimize the effect of outliers, we set a range limiting the amount of deviation recorded for each company. The metrics reflect consolidated statutory financials for each group, which are limited to US-domiciled entities that file annual statements with the National Association of Insurance Commissioners.
The 13 weighted deviations were then added together to calculate a final score, and the companies were ranked according to these scores.
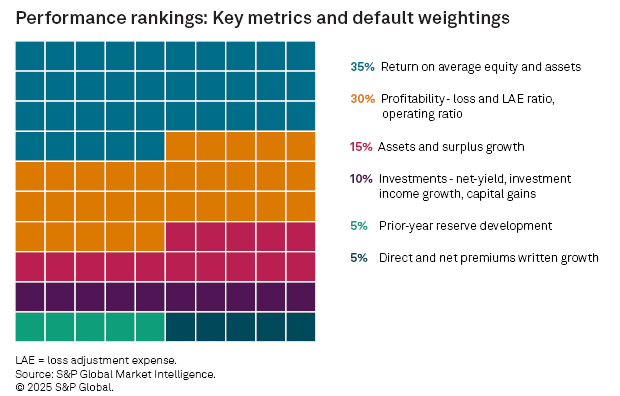
In addition to the 35% weighting assigned to rates of return, we applied the following weightings to the other five buckets: 30% to underwriting profitability, which includes the loss and loss adjustment expense ratio adjusted for reserve development, and operating ratio; 15% to asset and surplus growth; 10% to investment performance; and 5%, apiece, to reserve development and premium growth.
The respective weightings, with a heavy emphasis on returns and underwriting profitability, reflect our view that strong earnings represent the most important measure of a company's performance. Our weightings deemphasize investment results as the varying liability profiles and liquidity requirements of the various business models that are active in the sector inevitably lead to a wide array of outcomes in the metrics that contribute to our investment results bucket. These include growth in investment income, the net yield on invested assets and the ratio of realized capital gains and losses to average surplus.
Companies deemed to have an accident and health or commercial financial lines focus are excluded from this analysis.
Our interactive template allows users to adjust weightings for each of the six buckets to emphasize or deemphasize particular categories. Scores generated by the template may differ from those referenced in this article due to the receipt of new statutory financial information and/or revisions to our group structures.