Featured Topics
Featured Products
Events
S&P Global Offerings
Featured Topics
Featured Products
Events
S&P Global Offerings
Featured Topics
Featured Products
Events
S&P Global Offerings
Featured Topics
Featured Products
Events
Language
Featured Products
Ratings & Benchmarks
By Topic
Market Insights
About S&P Global
Corporate Responsibility
Culture & Engagement
Featured Products
Ratings & Benchmarks
By Topic
Market Insights
About S&P Global
Corporate Responsibility
Culture & Engagement
S&P Dow Jones Indices — 15 May, 2020
This article is reprinted from the Indexology blog of S&P Dow Jones Indices.
Since its debut in April 2000, the S&P/ASX Index Series has served as the de facto measure of value and performance for the Australian stock market, becoming an integral part of the country’s market infrastructure. 2020 has tested the resilience of that infrastructure; as pandemic fears gripped financial markets, stocks ricocheted, and trading in index-linked instruments spiked. During this period of volatility, the S&P/ASX Index ecosystem provided crucial liquidity to market participants.
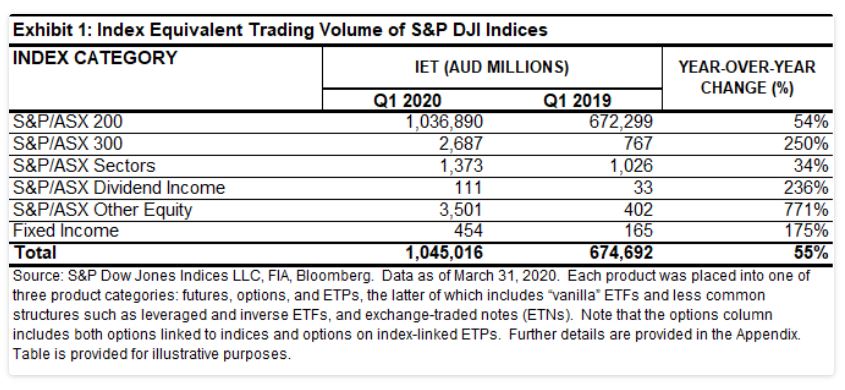
In Q1 2020, many market participants used the most liquid, transparent instruments available to manage their exposure to equities. Futures, options, and exchange-traded funds (ETFs) linked to the S&P/ASX Index Series saw record trading volumes, with over AUD 1 trillion in index-linked trading during the first quarter—a 50% increase from the first quarter of 2019. Trading was mostly concentrated in products tracking the S&P/ASX 200, but products tracking other S&P/ASX Indices saw larger relative increases, with trading tripling year-over-year in products associated with the S&P/ASX 300 and the S&P/ASX Dividend Indices.
Exhibit 1 is updated from our recent paper “Marking 20 Years of the S&P/ASX Index Series,” in which we highlighted the potential liquidity benefits of the ecosystem of tradable products surrounding the S&P/ASX Index Series. We measured the economic value, or index equivalent trading (IET), of futures, options, and ETF trading linked to the S&P/ASX Index Series, in order to capture the value of notional exposure to the underlying index.1

One of the benefits of higher volumes is the potential for lower trading costs. Products linked to the S&P/ASX Index Series displayed some of the lowest trading spreads of all Australian-linked and Australian-focused ETFs, with products linked to the S&P/ASX 200 typically displaying the lowest spreads of all.
In March 2020, trading costs soared globally, providing the test of record highs in volatility. Across the whole first quarter, average bid-ask spreads were wider across the board for Australian ETFs.
The average bid-ask spread on Australian-listed ETFs linked to the S&P/ASX 200 was 0.17%, while the average bid-ask spread for all Australian-listed and Australian-focused ETFs was 0.75%. Compared to the equivalent figures for 2019, spreads on ETFs linked to the S&P/ASX 200 rose by only 12 bps, while the average was 39 bps.2 Of the five Australian ETFs with the lowest average bid-offer spreads in Q1 2020, four were linked to the S&P/ASX 200, S&P/ASX 50, or S&P/ASX 300 (see Exhibit 2).

Market efficiency is not the gift of a benevolent providence. A trading ecosystem sufficiently large and active can benefit asset owners and investment managers by offering transparency, efficiency, and improving confidence. And as markets reached lows, the importance of liquidity and benefits of a large and trusted ecosystem reached new heights.
1 See “A Window on Index Liquidity: Volumes Linked to S&P DJI Indices,” (2019), for details of how the IET is calculated for various types of products.
2 See Exhibit 10 of “Marking 20 Years of the S&P/ASX Index Series,” (2020), for details on Average Bid-offer Spreads in 2019.