


BLOG — Mar 18, 2021
Global Trade Monitor - March 2021

Recovery emerging from East & Southeast Asia to become global in 2021 with a particularly strong growth impulse predicted for Q2; several scenarios are still possible depending on the dynamics of COVID-19 pandemics and effectiveness of mass vaccination programs.
Main observations
- The most recent real GDP growth forecasts from IHS Markit were published on 15 March. We predict global recovery in 2021 with year-on-year (yoy) real GDP growth rates predicted to reach 5.1% (4.3% in 2022) thus adjusted upwards in comparison to the February release. The growth rates are predicted to vary between 4.5% (3.8 in 2022) for advanced, 6.2% (5.0%) for emerging, and 4.8% (4.7%) for developing states
- Trade data is consistent with the above and indicate a recovery that started already in 2020 in East & Southeast Asia and in particular China & South Korea
- The UK seems to be suffering the compared to the rest of the top ten group in 2020 and early 2021, a combined effect of COVID-19 and harsh lockdowns related to the spread of the British variant and Brexit as well as disappointment with the negotiations and the final results of the UK-EU trade agreement
- In January 2021 most top ten reported yoy growth in the value of exports varying from +3.1% for Brazil, +3.5% for Canada, +11.4% for South Korea, and +12.7% for Japan; the US (-1.1%), and the UK (-25.4%) reported a decline
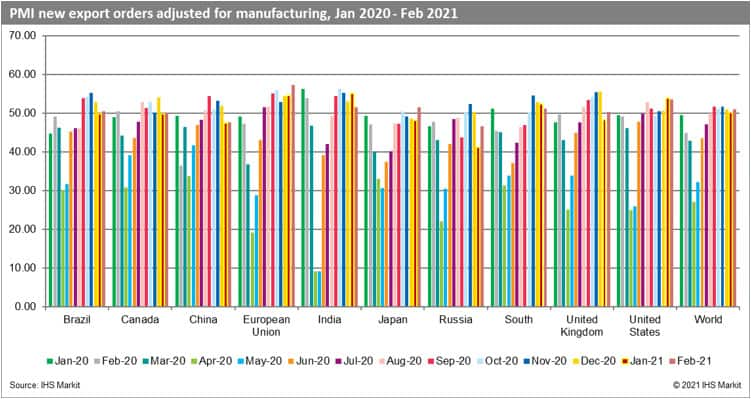
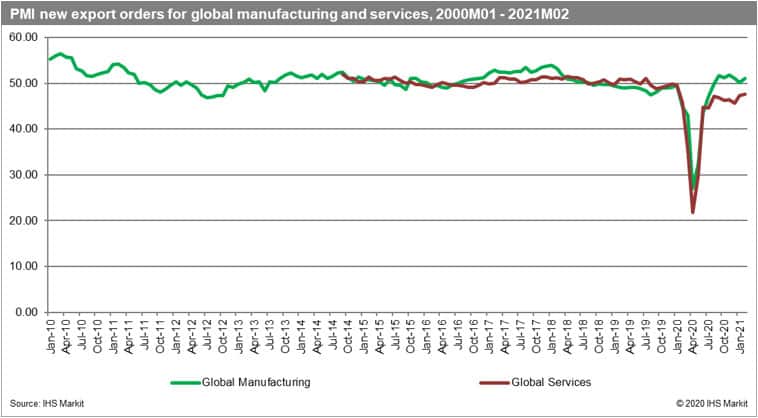
- The adjusted manufacturing PMI NExO readouts in February 2021 are above the benchmark value of 50.0 points for global manufacturing (51.05, a rise of +0.90 on the January 2021 readout) and eight out of top ten economies; growing market optimism increases the likelihood of a sustained recovery unless a dramatic shift in the dynamics of the pandemic occurs and/or mass vaccination programs fail
Changes in Trade of the Top Ten Economies
- With the new trade data updated regularly in our Global Trade Atlas as reported by the states, we have the first estimates of the total contraction in trade in 2020 for most of the top ten economies adjusted in comparison to the last report due to updates made by reporters
- Chinese exports have increased in 2020 by 4% yoy - the contraction was present only in Q1 (-13.4% followed by a steady recovery: +0.1% in Q2, +8.8% in Q3, and +17.1% in Q4. All other top ten economies suffered a contraction in exports in 2020 which varied from -5.5% for South Korea, -6.9% for Brazil, -9.1% in Japan, -12.5% in Canada and -12.9% in the case of the US; the largest declines were present in India (-14.8%) and the UK -15.3% (we don't have full records yet for the EU and Russian Federation)
- It is worth noting that exports were growing in value yoy in the Q4 of 2020 for China (+17.1%), Japan (+3.5%), and South Korea (+4.2%); overall East & Southeast Asia seems to be the origin of the global recovery
- In December 2020, four countries showed a yoy increase in the value of exports: China (+18.6%), South Korea (+12.4), Japan (+7.7%) & India (+0.2%); the US (-2.0%) and Canada (-2.1%) reported a similar decline with the largest yoy decline for the UK (-4.6%)
- In January 2021 most top ten reported yoy growth in the value of exports varying from +3.1% for Brazil, +3.5% for Canada, +11.4% for South Korea, and +12.7% for Japan; the US (-1.1%), and the UK (-25.4%) reported a decline
- China (mainland) is going to report the data for the first two months of 2021 similarly to 2020 jointly; a principle of equal split would have to be applied, it is very likely, though, that Chinese exports have grown for the ninth month in a row
- Japanese and Brazilian exports have grown for two months in a row, the upturn is more sustained in South Korea (the fourth month of increases); the situation is serious in the UK - the last yoy increase in the value of exports was reported in January 2020 (pre-COVID)
- Two top ten economies have already reported the value of exports for February 2021, it's Brazil with a growth of +3.9% and South Korea +9.5%; early results are promising
- The UK seems to have suffered the most out of the top ten group, a combined effect of COVID-19 and harsh lockdowns related to the spread of the British variant and Brexit as well as disappointment with the negotiations and the final results of the UK-EU trade agreement
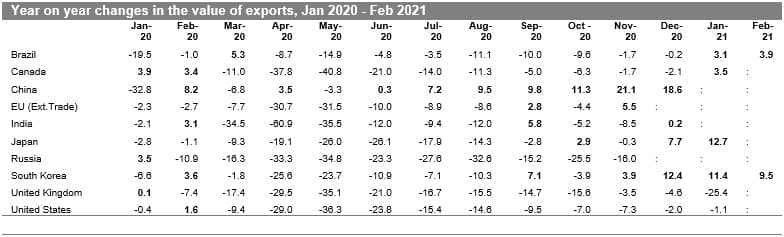
Source: IHS Markit Global Trade Atlas. * Data for China using equal split between Jan & Feb 2020 due to the reporting
- In most of the top ten group the contraction in imports in 2020 (apart from the US and Canada), was deeper than the contraction in exports; all the economies that have already reported the full data for 2020, suffered a decline in 2020 ranging from -0.4% yoy for China, -6.4% in the US, -7.1% in South Korea, -9.4% for the UK, -10.4% in Brazil, -10.7% in Canada and -11.9% in Japan; Indian imports declined by a massive 23.5%
- All top ten economies reported contraction in imports in Q1 and Q2 of 2020; in Q3 imports were growing only in the case of China; in Q4 2020 imports were above 2019 levels in most of the top ten states apart from South Korea (-1.7%), India (-5.7%) and Japan (-8.3%)
- December is usually a better month for imports in advanced states fueled by the holiday season and new year celebrations. All the countries that have reported data for December 2020 show a significant increase in the value of imports yoy, apart from Japan; the growth rates range from +2.2% in Canada to a massive increase of +46.7% in Brazil
- It is worth noticing that recovery in imports seems to be consistent and continuing in several key countries, these are in particular China (Four months of recovery in a row, likely to be increasing in Jan-Feb 2021 as well), the US (Fourth month in a row) and South Korea (Third month in a row and recovery in imports accelerating); it could be indicative of growing consumer confidence and increasing internal demand strengthening the likelihood for sustained recovery
- With incoming data on progress with mass vaccination programs in particular in key advanced states, the likelihood of stricter lockdowns decreases and that could have a positive impact on overall market optimism unless the third wave of COVID-19 pandemic escalates out of control
- In January 2021, imports were growing yoy in South Korea (+3.6%) and the US (+4.3%); and declined in the remaining top ten group with the largest decline yoy for the UK (-15.6%); it seems that UK citizens prepared for potential hard Brexit at the end of 2020 (increases in the value of import by 12.7% in November and 20.1% in December, and then reacted in January due to signing of the UK-EU trade deal)
- Brazil reports a +13.4% increase yoy in the value of imports in February 2021; the increase is even stronger for South Korea (+13.4%)
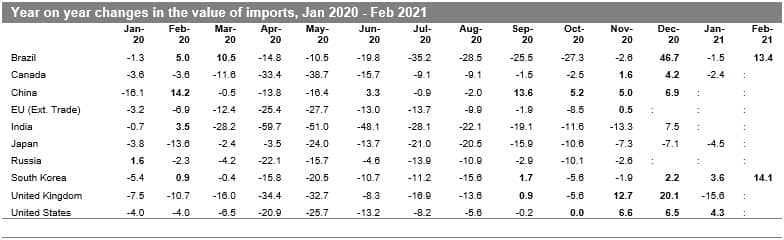
Source: IHS Markit Global Trade Atlas. * Data for China using equal split between Jan & Feb 2020 due to the reporting.
Prospects for the Forthcoming Months
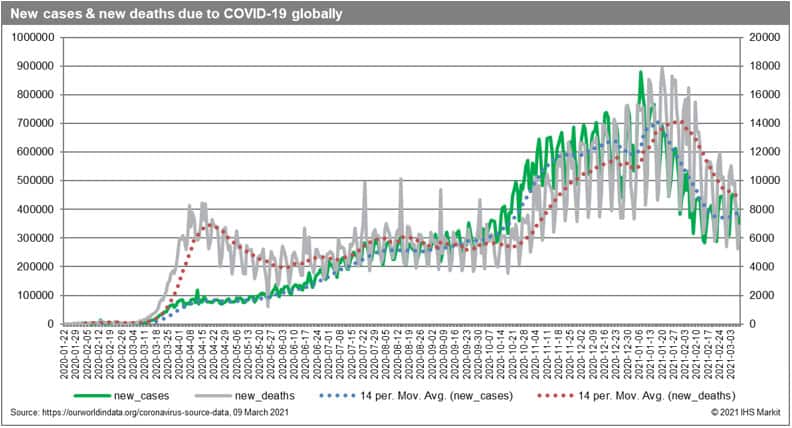
- The reaction in trade in 2020 was consistent with the escalating global COVID-19 pandemic and steps taken by individual countries/territories in controlling or mitigating it. The situation in 2021 is likely to be similar with the development dependent on the success of mass vaccination programs and the severity of the third wave. The overall impact of COVID-19 on global trade and the global economy will depend on the duration, severity, and spatial distribution of the pandemic and associated severity of containment efforts taken by individual states.
- The cumulative number of confirmed cases of COVID-19 globally reached 117.1 million and 2.8 million deaths on 8 March 2021
- The cumulative number of cases are the largest in Europe (35.4 million), North America (33.4 million), Asia (25.6 million), and South America (18.7 million)
- The cumulative number of cases is the highest in the US (29 million), India (11.2 million), Brazil (11.1 million) followed by Russia (4.3 million), the UK (4.2 million), France (4.0 million), Spain (3.2 million), Italy (3.1 million), Turkey (2.8 million), Germany (2.5 million), Columbia (2.3 million), Argentina (2.2 million), Mexico (2.1 million), Poland (1.8 million), Iran (1.7 million), South Africa & Ukraine (1.5 million each), Peru & Indonesia (1.4 million each), Czech Republic (1.3 million) and the Netherlands (1.1 million). Therefore, 21 countries so far have registered more than one million cases of COVID-19.
- The adjusted PMI new exports orders (PMI NExO) readouts for the manufacturing industry in February 2021 are above the benchmark value of 50.0 points for global manufacturing (51.05, a rise of +0.90 on January 2021 readout) and eight out of top ten economies. The highest readouts for February are present for the European Union (57.37), United States (53.65), India (51.55), Japan (51.49) & South Korea (51.24). The lowest PMI values (below the benchmark value) are reported for the second month in a row for Russia (46.55) and China (47.57)
- The PMI for the EU shows a positive trend in the third month in a row while for South Korea it is exactly the opposite (still the values are above 52.0); the positive trend finished in the US, and a negative one has disappeared in Japan
- In comparison to January 2021, the highest increases are identified for Russia (+5.29), Japan (+3.28), the EU (+2.73); the largest falls, in turn, can be seen in India (-3.50) and South Korea (-1.13); the results for the UK after a disappointing January are positive and values of its PMI NExO point to expansion in trade
- Both PMI NExO for global manufacturing and global services showed a rapid COVID-19 crisis and quick recovery of V-shaper, however, the readouts for services are permanently below the 50.0 points benchmark (since July 2019); in recent months the situation in services started to improve (a second month in a row) and the situation in global manufacturing improved on January readouts (the readouts stand at 51.06 for global manufacturing and 47.59 for global services)
- The most recent real GDP growth forecasts from IHS Markit were published on 15 March 2021. The forecast includes the baseline scenario of the impact of COVID-19 on the global economy and individual states
- We now estimate the contraction of global GDP by 3.6% in 2020 varying between -4.7% for advanced, -1.7% for emerging, and -5.6% for developing economies
- We predict global recovery in 2021 with yoy real GDP growth rates predicted to reach 5.1% (4.3% in 2022) thus adjusted upwards in comparison to the February release. The growth rates are predicted to vary between 4.5% (3.8 in 2022) for advanced, 6.2% (5.0%) for emerging, and 4.8% (4.7%) for developing states
- From a quarterly perspective, both Q3 (-1.5%) and Q4 (-0.6%) proved to bring a continuing global recession in 2020. We predict a global recovery already in the Q1 of 2021 (+3.3%) driven mostly by emerging states with a stronger boost only in Q2 of 2021 (+10.1%). The predictions for the first two quarters of 2021 have been adjusted upwards from the preceding release
- Recovery in China has already started in Q2 of 2020 following the COVID-19 related contraction in the first quarter. Apart from China (+18.8%), two other economies out of the top ten group are predicted to grow in the first quarter of 2021, these are Brazil (+0.25%) and South Korea (+0.4%). The major recovery in all the states has been predicted continually for the second quarter of 2021. The lastly predicted recovery for India already in Q1 has been postponed by one quarter
This column is based on data from IHS Markit Maritime & Trade Global Trade Atlas (GTA) & GTA Forecasting.
For more details about Global Trade Atlas (GTA) please visit the product page
For more details about Global Trade Atlas Forecasting please visit the product page
The full version of this article is available on the Connect platform for IHS Markit clients with a subscription to GTA/GTA Forecasting.
Subscribe to our monthly newsletter and stay up-to-date with our latest analytics