


Research — Nov 4, 2024
Wind speeds hit the brakes again in Q3, affecting top North America wind owners

By Tony Lenoir
US wind speeds shifted into lower gear again in the three months to Sept. 30, 2024, making the June quarter's high winds stand out as an outlier over the last 15 months. Turbines across Canada and Mexico also experienced slower-than-normal wind velocity, helping to send the portfolios of all top 20 owners of operating wind capacity in the region into negative territory.

Though growing, the wind generation fleet across the US, Canada and Mexico faced yet another period of suboptimal air current speeds in the September quarter — conditions in which running times and production presumably suffered, underscoring challenges around intermittency.
With most of the largest negative deviations affecting territories known for propitious wind speeds — thus heavily targeted by wind developers — no top wind capacity owner was spared, potentially affecting earnings tied to the renewable source of energy during the period.

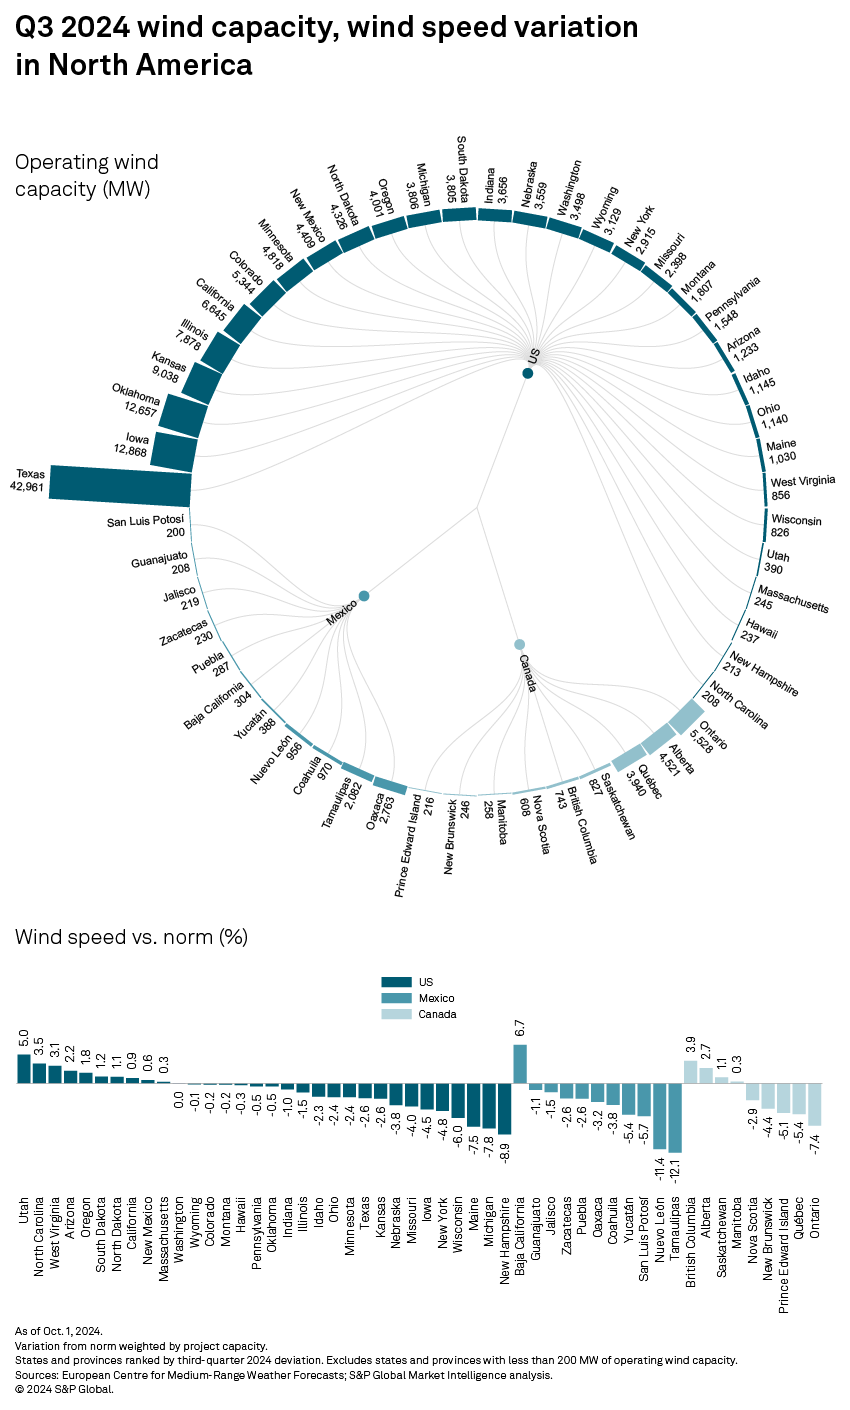
On average, the growing North American wind generation fleet — up 4.5% year over year to 179.3 GW — was powered by air currents 2.2% below the 20-year norm in the third quarter, with the retreats ranging from a 1.9% downtick in the US to a 6.4% plunge in Mexico. Projects in the Mexican state of Tamaulipas, on the Gulf of Mexico just south of Texas, notably contended with wind speeds 12.1% below normal. With 2.1 GW, Tamaulipas accounted for nearly 24% of Mexico's operating wind capacity during the period under consideration.
Download data details in Excel.
In the US, 21 of the 32 states with at least 200 MW of wind capacity logged speeds below average. Decelerations were particularly acute in the northeast, with projects in New Hampshire recording the largest pullback, down 8.9% from the norm. Iowa, which derives more than two-thirds of the power it generates from wind, saw a 4.5% dip. In Texas, home of the largest statewide US wind park, speeds came in 2.6% below normal. On the other end of the spectrum, states generally associated with solar energy generation — Utah, North Carolina, West Virginia and Arizona — logged positive fluctuations.
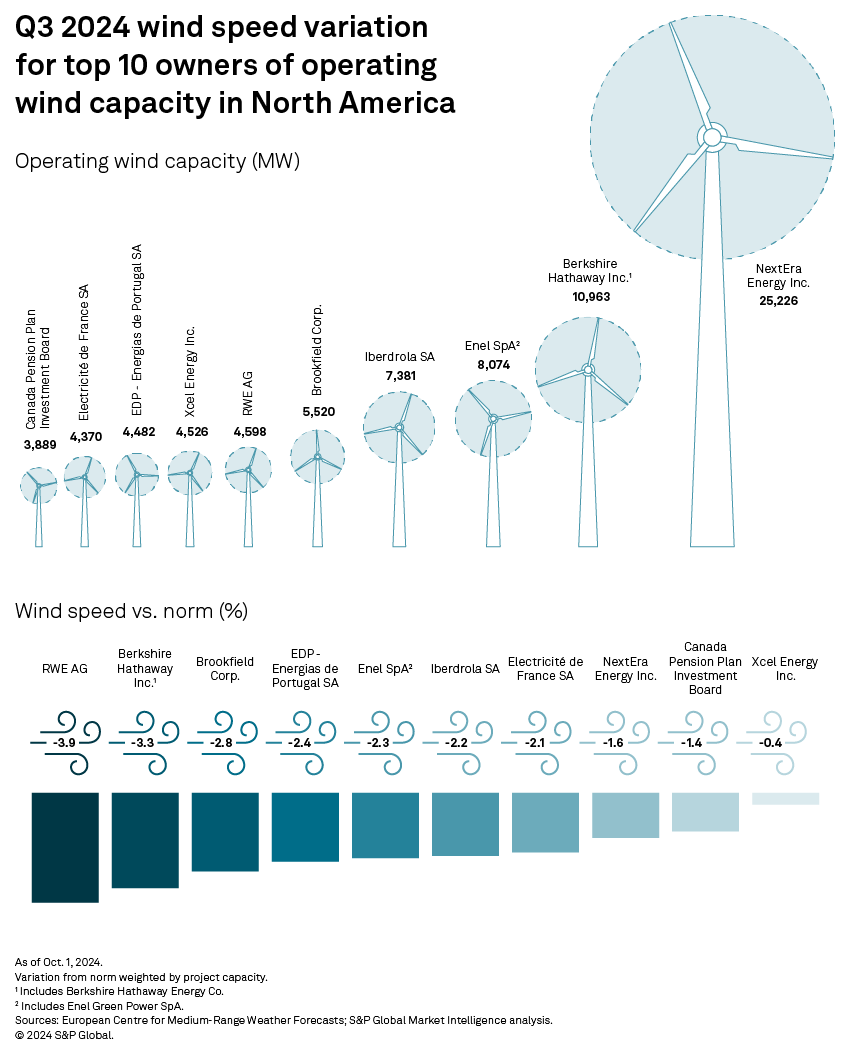
Among the top 10 owners of wind capacity in North America, only Xcel Energy Inc. experienced wind speeds tracking closely to the 20-year trend, down a marginal 0.4%. Two of the company's three largest wind farms — 522-MW Sagamore Wind Project in New Mexico and 478-MW Hale Community Energy in Texas — benefited from faster-than-normal speeds, up 1.4% and 2.5%, respectively. Sagamore and Hale Community accounted for over 22% of Xcel Energy's wind capacity in the September quarter.
Across the rest of the group, negative fluctuations ranged from 1.4% for the Canada Pension Plan Investment Board's portfolio, which was particularly affected by significant negative deviations in Ontario, to 3.9% for RWE AG. Of the investment board's 43 wind projects, 22 operated in suboptimal wind conditions, with double-digit retreats from the norm for six of them.
Texas-based projects, which account for more than 73% of RWE AG's overall wind capacity, weighed heavily on the company's portfolio average. Fourteen of RWE's 25 Texas wind projects, or about 46% of the company's wind capacity in the state, logged decelerations ranging from 6.2% to 13.3%. Those projects are in the southern third of Texas, including a handful not too far from the border with Mexico's Tamaulipas state.
Texas wind speed downshifts were less dramatic for North America's wind capacity leader NextEra Energy Inc. On average, wind across the company's Texas-based generation fleet blew about 1.5% slower than normal. NextEra's 1,027-MW Great Prairie Wind Project, the largest US wind farm, saw wind speeds recede 1.1% from their 20-year average. Most of NextEra's Texas-based wind projects are in the northwestern quarter of the state.
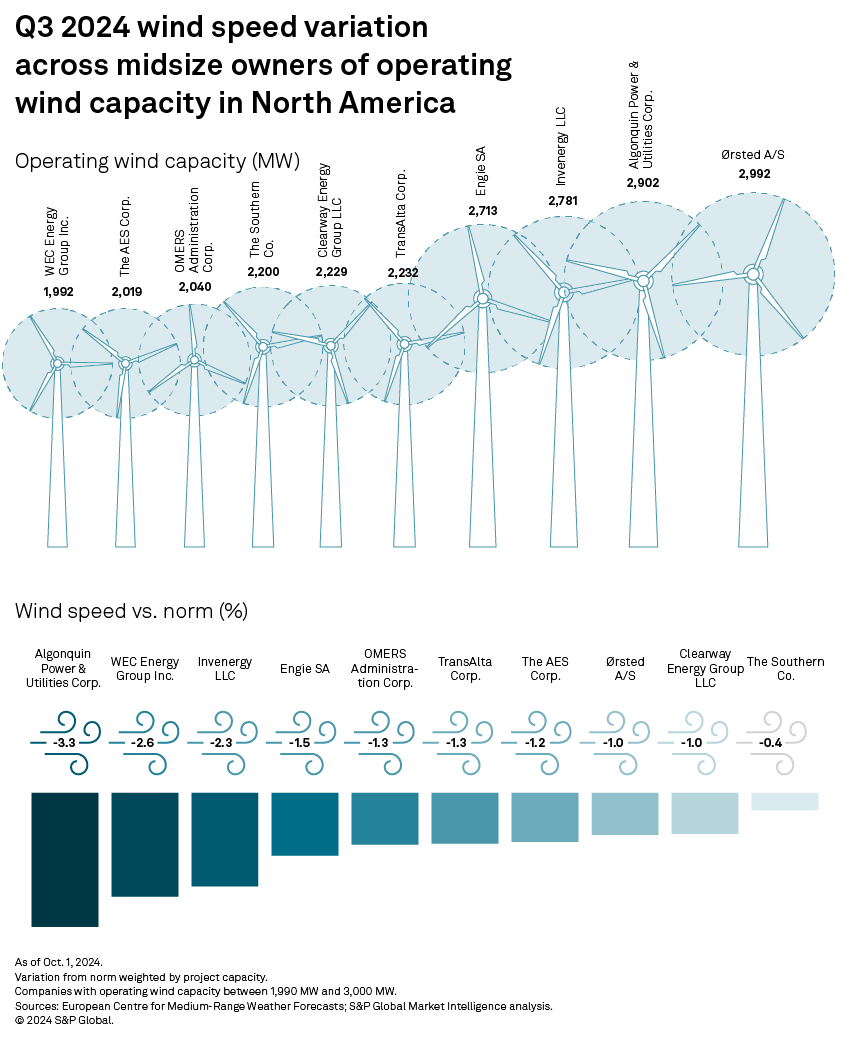
Portfolios across the midsize operator segment (companies holding between 1,990 MW and 3,000 MW) tell a similar story. All of them ran in subpar wind speed conditions in the September quarter, with the negative departures from the norm ranging from 0.4% at Southern Co. to 3.3% at Algonquin Power & Utilities Corp.
Just like for RWE AG and NextEra Energy, Texas-based projects played a determinant role in Algonquin's portfolio-average wind speed. All Algonquin wind projects, save one — the 150-MW Senate Wind Project, about 100 miles northwest of the Dallas-Fort Worth metropolitan area — faced more sluggish winds than usual. Stella Wind Farm, West Raymond Wind Farm (Big Raymond Wind Project) and East Raymond Wind Farm (Big Raymond Wind Project), which account for 30.2% of Algonquin's Texas wind capacity, experienced wind retreats ranging from 12.3% to 13.3%. Over 37% of Algonquin's wind capacity is based in Texas.
The wind speed 100 meters above the ground is measured from the fifth-generation European Centre for Medium-Range Weather Forecasts reanalysis. The data is available at quarter-degree latitudes and longitudes, with a spacing of slightly over 27.5 km. This analysis compares the 2024 third-quarter wind speed values with the 20-year wind speed average from 2003 through 2022.
Data visualization by Rameez Ali.
For wholesale prices and supply and demand projections, see the S&P Global Market Intelligence Power Forecast.
Regulatory Research Associates is a group within S&P Global Commodity Insights.
S&P Global Commodity Insights produces content for distribution on S&P Capital IQ Pro.
Monesa Carpon contributed to this article.
This article was published by S&P Global Market Intelligence and not by S&P Global Ratings, which is a separately managed division of S&P Global.
S&P Global Commodity Insights produces content for distribution on S&P Capital IQ.
Regulatory Research Associates is a group within S&P Global Commodity Insights.
For a full listing of past and pending rate cases, rate case statistics and upcoming events, visit the S&P Capital IQ Pro Energy Research Home Page.
For a complete, searchable listing of RRA's in-depth research and analysis, please go to the S&P Capital IQ Pro Energy Research Library.