


Research — Nov 29, 2024
US solar capacity factors retreat in 2023, break multiyear streak above 24%

By Tony Lenoir
Solar capacity factors fell across all US independent system operators in 2023, sending the weighted US average below the 24% mark for the first time in at least five years. The pullback contributed to keeping the share of solar in overall US electricity generation under 4.0%, despite a 27.9% increase in utility-scale photovoltaic capacity year over year.
The weighted average US solar capacity factor came in at a calculated 23.5% annually in 2023, down 0.7 percentage point from 24.2% in 2022. With the performance metric primarily influenced by the Earth's orbit around the sun, it oscillated between 30.8% in June and July and 13.2% in December, languishing below the annual average six months out of the year — a period during which the inconsistencies between 24/7 power needs across wide swaths of the economy and solar energy intermittency are magnified (see S&P Global Commodity Insights' US datacenters and energy 101 interactive report).
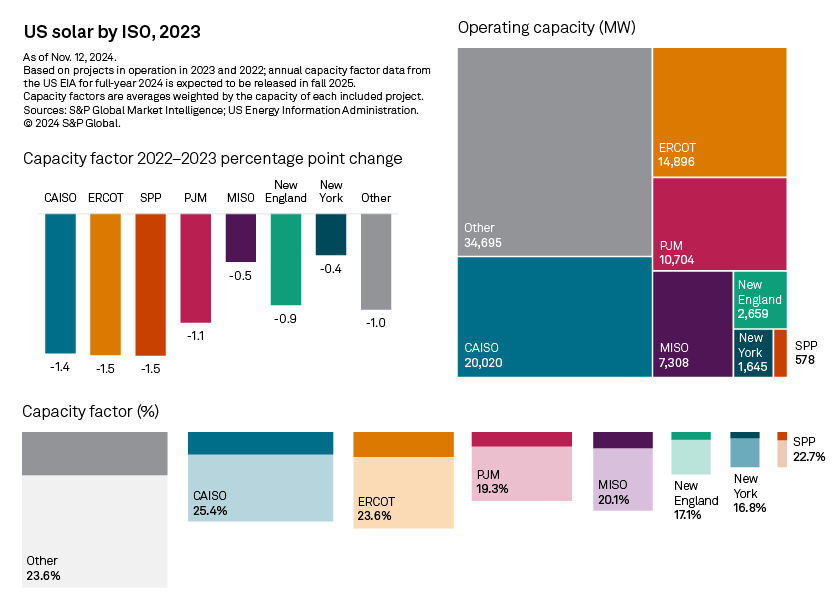
Regionally, the Electric Reliability Council of Texas Inc. and the Southwest Power Pool experienced the largest decline, down 1.5 percentage points each. The California ISO, which topped the ISO solar capacity leaderboard at the end of 2023, was not too far behind, with photovoltaic projects in the territory experiencing a 1.4-percentage-point drop in utilization in the 12 months to Dec. 31, 2023. Across ISO zones, CAISO nevertheless retained its capacity-factor lead, with the region's solar generation fleet averaging 25.4%.
Download data details in Excel.
Solar capacity factors in 30 of the 39 US states with at least 100 MW of solar capacity in 2023 retreated year over year. Arkansas, Ohio and Maine logged the largest declines, with drops ranging from 2.9 percentage points to 5.1 percentage points. State-level average solar capacity factors came in particularly low in the northeastern US, with New Hampshire, New Jersey, Pennsylvania and Vermont all under 16%, and Connecticut, Maine and Rhode Island not much higher. But these states had only 3.2 GW in aggregate of large-scale solar capacity at the end of 2023, or 3.4% of the US total.
The Western Interconnection shines on the other end of the spectrum, with eight of the top 10 states by average solar capacity factor belonging to this subsection of the broader US grid. The territory, which offers vast swaths of available land and features climatic conditions generally favorable to renewables, including top insolation levels, is increasingly prized by power-hungry sectors such as manufacturing and technology, including datacenters (see US datacenters and energy interactive report).
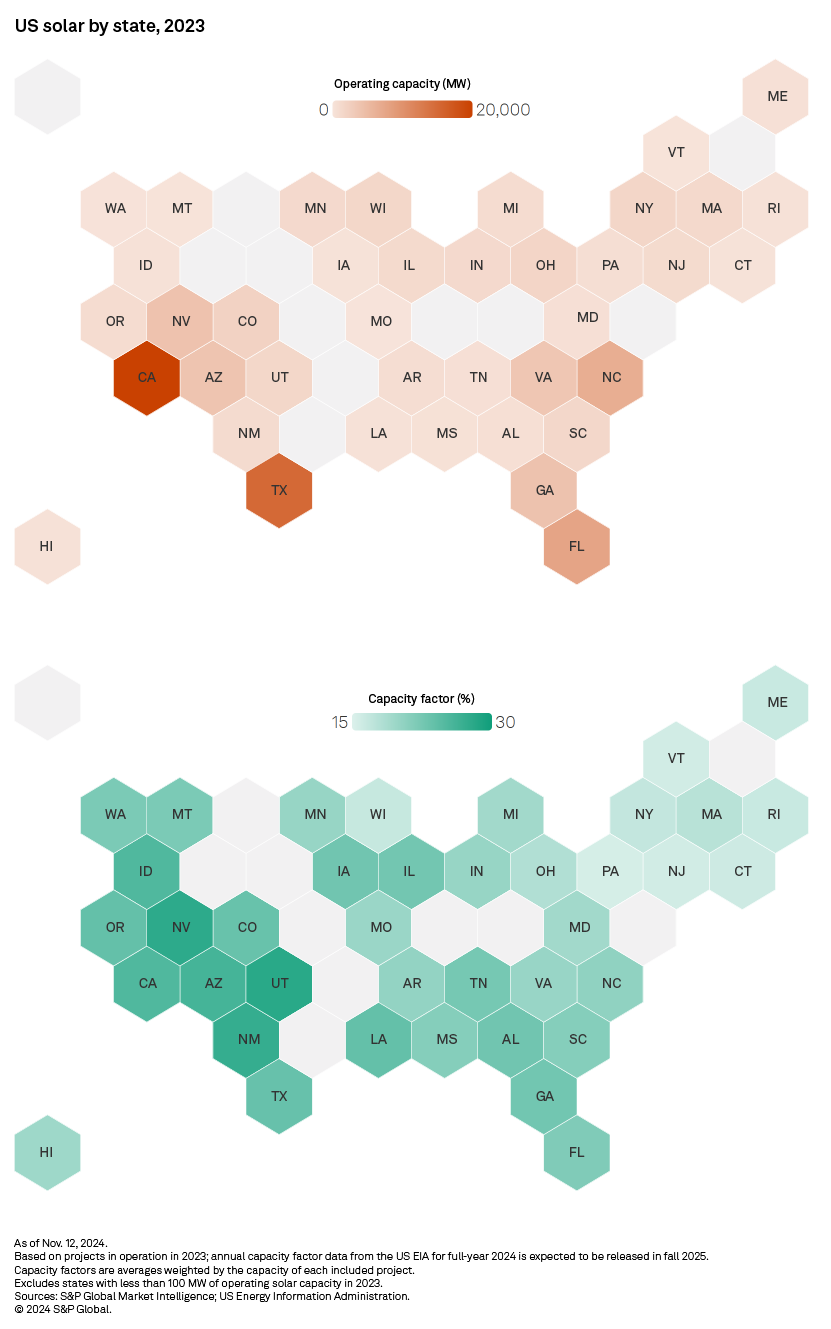
This is particularly true for the southwestern US, notably Nevada — home of a booming datacenter market revolving around regional workloads. The Desert Southwest again achieved the highest state-average solar capacity factors in 2023, with Utah, Nevada, New Mexico and Arizona — across which the metric ranged from 26.1% to 28.1% — respectively ranking first through fourth. Combined, however, the four states had a photovoltaic generation fleet of only 10.8 GW as of Dec. 31, 2023, accounting for 11.7% of the US total.
Of note, this compares to 19.9 GW and 15.1 GW, respectively, for utility-scale solar capacity leaders California and Texas (as of the end of 2023). In 2023, the state-level solar capacity factor came in above the national average in California while it was essentially in line with the US-wide metric in Texas. But solar curtailment is rising across CAISO and ERCOT as plant operators must manage the mismatch between peak generation from their fast-expanding solar generation fleets, which generally occurs around noon, and peak load hour, which takes place late afternoon or early evening.
Failing to deliver on the big push toward energy storage might exacerbate the trend — a development that could weigh on solar capacity factors in the regions. California and Texas had a combined 113.7 GW of additional solar capacity in the pipeline and an aggregate 102.8 GW of planned battery energy storage capacity as of writing, based on S&P Global Market Intelligence data.
Data visualization by Rameez Ali.
S&P Global Commodity Insights produces content for distribution on S&P Capital IQ.
Regulatory Research Associates is a group within S&P Global Commodity Insights.
For wholesale prices and supply and demand projections, see the S&P Global Market Intelligence Power Forecast.
For a full listing of past and pending rate cases, rate case statistics and upcoming events, visit the S&P Capital IQ Pro Energy Research Home Page.
For a complete, searchable listing of RRA's in-depth research and analysis, please go to the S&P Capital IQ Pro Energy Research Library.
Theme
Location