


Research — Dec 9, 2024
Slower air currents throw spanner in US wind fleet utilization rate in 2023

By Tony Lenoir
Adverse climatic conditions, which have persisted so far in 2024, translated into lower capacity factors year over year for the US wind generation fleet in 2023, with all independent system operators — save the Electric Reliability Council of Texas Inc. — experiencing lower utilization rates.
Nationally, US wind projects averaged a calculated 33.2% capacity factor in 2023 versus about 35% in 2022. In comparison, utility-scale solar ran less than 24% of the time in the 12 months to Dec. 31, 2023. Issues pertaining to renewable energy intermittency have been under the spotlight amid the AI-driven datacenter boom, with round-the-clock power needs of the GPU-housing facilities clashing with the green objectives of their owners.
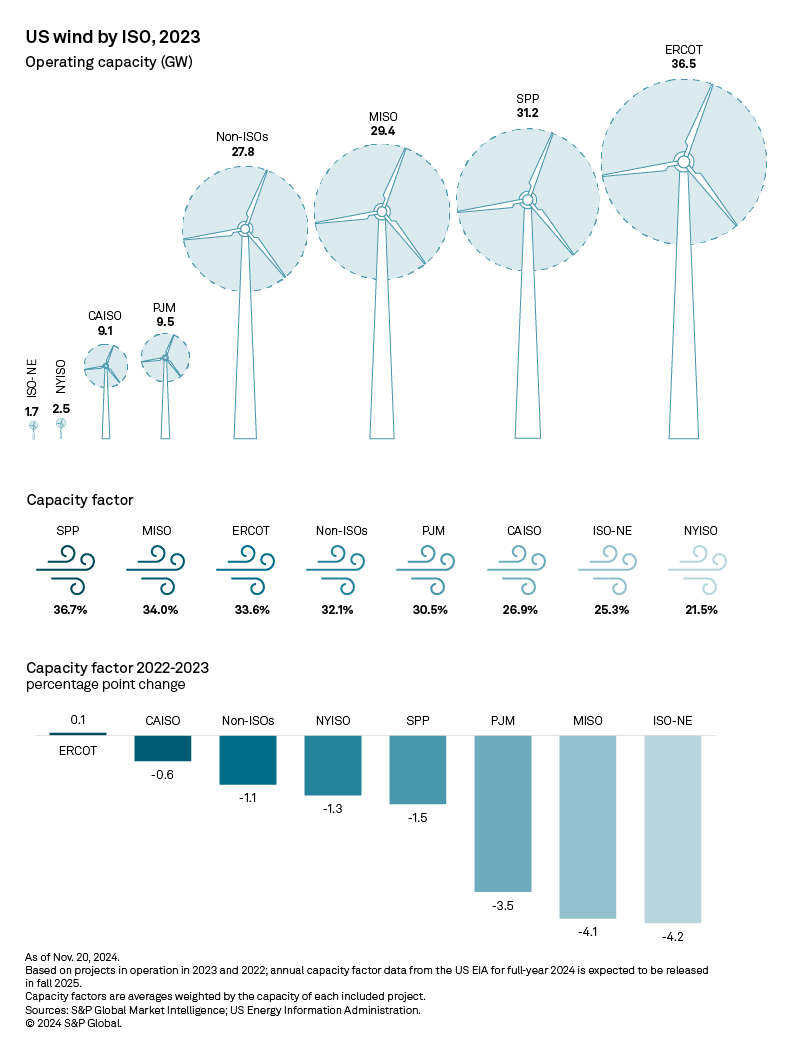
Overall, weighted average wind capacity factors declined in 31 of the 35 states with at least 100 MW of wind capacity as of Dec. 31, 2023. The Midcontinent ISO and the Southwest Power Pool topped the charts for the key performance metric in 2023, with six states from these territories in the top 10. New Mexico, however, led the pack, averaging 38.6% in 2023 on a 1.1 percentage-point uptick.
Download data details in Excel.
The Northeast trails the US heartland by a significant margin in wind plant utilization, with ISO-wide average capacity factors coming in at a calculated 25.3% and 21.5% in ISO New England and New York ISO, respectively. On the opposite coast, California — famed for its generally mild weather year-round — fares slightly better, with the wind park across California ISO running 26.9% of the time in 2023.
For perspective, however, CAISO, ISO-NE and NYISO combined had 13.3 GW of wind capacity as of year-end 2023 — about 9% of the US total.
S&P Global Market Intelligence Power Forecast anticipates wind to contribute from 7.1% to 8.4% of overall state-generated electricity in California and New York in 2025. New England presents more of a mixed picture, with the projected metric ranging from nil to 6% across Connecticut, New Hampshire and Rhode Island and from 15.3% to 28.2% across Vermont, Massachusetts and Maine.
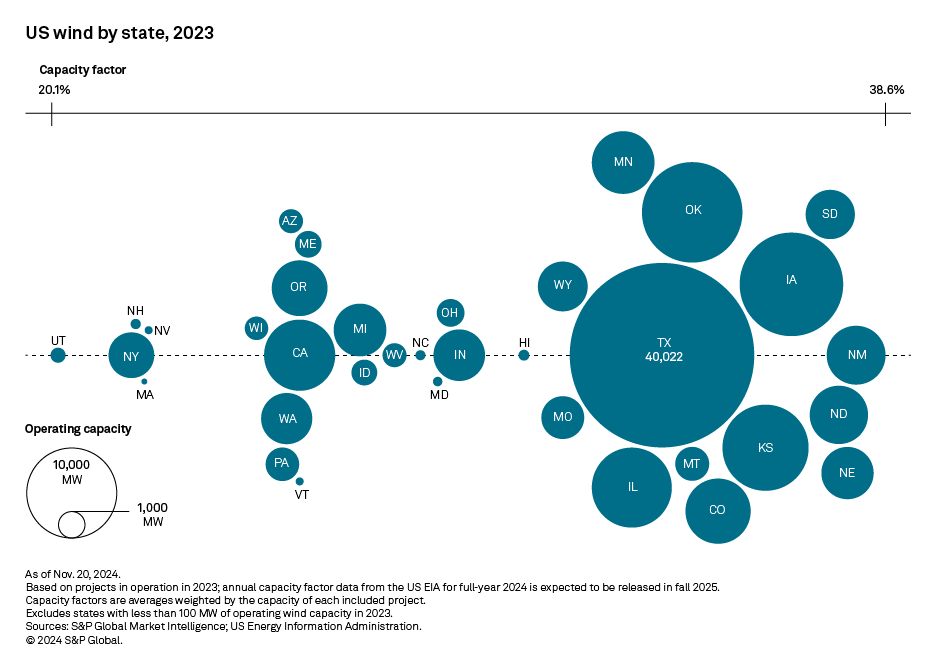
Turbine underperformance can be much more problematic in Iowa, where Power Forecast expects wind to account for approximately 55% of overall state generation in 2025 and nearly 68% by 2035. The state's wind generation fleet averaged a 37.1% utilization rate in 2023, down more than five percentage points year over year. Iowa's top two wind projects by capacity — Highland Wind (Wind VIII & IX Project) and Orient Wind Farm (Wind XI) — notably experienced nonnegligible declines in running time, with annual capacity factors of 38.9% and 39.7, respectively, in 2023 versus 45.0% and 48.9% in 2022 in the same order.
Texas, which leads the renewable energy space in the US including wind, had its turbines running 34.1% of the time on average in 2023 — slightly above ERCOT's 33.6% — suggesting higher utilization rates for projects located in the Texas panhandle. The state ended 2023 with more than 40 GW of wind capacity — about 27.1% of the US total. It had an additional 13 GW in the pipeline as of writing and more than 29 GW seeking to connect to the grid as of April 2024, according to an S&P Global Commodity Insights analysis of interconnection queues.
Texas — home to markets increasingly prized by datacenter developers, notably Dallas and San Antonio — is a hot spot for corporate procurement, with 22.2 GW of renewable capacity contracted by corporate offtakers as of our latest annual survey of the space, including 9 GW of wind. Given this context, dips in renewable generator utilization rates in the state may impact high-profile offtakers such as Amazon.com Inc., AT&T Inc. and Meta Platforms Inc. In 2023, wind projects in Texas experienced wind speeds markedly slower than the norm in the second and fourth quarters.
Data visualization by Rameez Ali.
S&P Global Commodity Insights produces content for distribution on S&P Capital IQ.
Regulatory Research Associates is a group within S&P Global Commodity Insights.
For wholesale prices and supply and demand projections, see the S&P Global Market Intelligence Power Forecast.
For a full listing of past and pending rate cases, rate case statistics and upcoming events, visit the S&P Capital IQ Pro Energy Research Home Page.
For a complete, searchable listing of RRA's in-depth research and analysis, please go to the S&P Capital IQ Pro Energy Research Library.
Theme
Location