Featured Topics
Featured Products
Events
S&P Global Offerings
Featured Topics
Featured Products
Events
S&P Global Offerings
Featured Topics
Featured Products
Events
S&P Global Offerings
Featured Topics
Featured Products
Events
Financial and Market intelligence
Fundamental & Alternative Datasets
Government & Defense
Banking & Capital Markets
Economy & Finance
Energy Transition & Sustainability
Technology & Innovation
Podcasts & Newsletters
Financial and Market intelligence
Fundamental & Alternative Datasets
Government & Defense
Banking & Capital Markets
Economy & Finance
Energy Transition & Sustainability
Technology & Innovation
Podcasts & Newsletters
Research — 2 Nov, 2023

By Keith Nissen
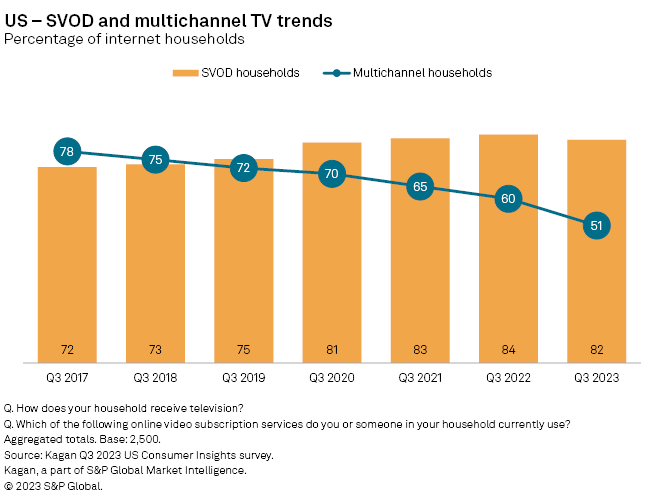
The adoption of subscription video-on-demand and free, ad-supported TV services has plateaued in the US with over 80% of internet households watching online video, according to a recent Kagan US Consumer Insights survey. At the same time, the decline in multichannel TV subscribers accelerated over the past year with barely half of internet households subscribing to a traditional pay TV service.

➤ The steady stream of pay TV subscriber losses since 2017 turned into a flood during 2023 with multichannel TV subscriptions declining 7 percentage points to 51% year over year.
➤ The percentage of internet adults watching primarily live TV declined from 40% in 2017 to 30% in 2023 while those watching primarily on-demand video increased from 6% to 22% over the same six-year period.
➤ The major SVOD services including Netflix, Amazon Prime Video, Hulu and Disney+ as well as major free video services such as YouTube, Tubi TV and Pluto TV maintained their shares of the market in 2023.
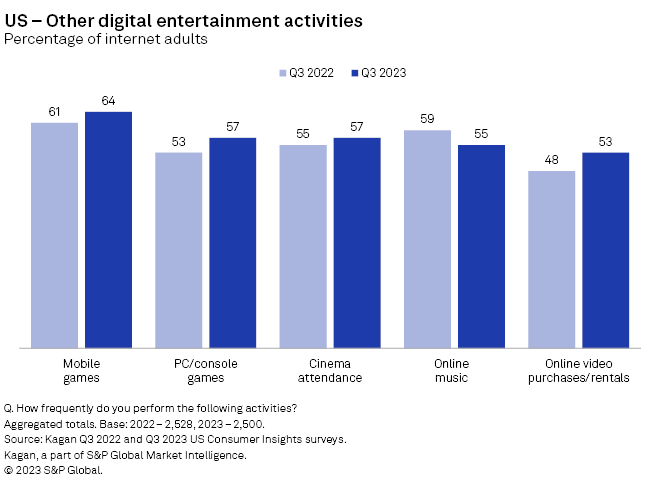
➤ Video gaming remains strong with approximately 60% of US internet adults playing games. Cinema attendance and online video purchases/rentals also showed positive growth.

Data collected from the third-quarter 2023 US Consumer Insights survey shows that overall use of online SVOD services has plateaued with over 80% of US households using at least one service. At the same time, multichannel TV subscriptions continue to plummet, declining from 78% in 2017 to 51% in late 2023. The video cord-cutting trend appears to have accelerated during 2023, in part due to fewer first-time subscribers.

For years, consumers have perceived SVOD and online video in general as being supplemental to live TV programming delivered either through multichannel (MVPD) TV services, online virtual MVPD services or over-the-air broadcast TV programming. For example, in 2017 approximately seven in 10 (69%) of internet adults said they primarily watched live TV or mostly live TV with some on-demand video. Since then, the percentage of those watching primarily or mostly live TV has shrunk to less than half (48%) of internet adults. Until recently, the shift toward watching more on-demand content has been subtle, with consumers maintaining a mix of both live TV and on-demand video viewing. However, the latest survey results show a substantial increase in households (22%) that are watching primarily on-demand video. This suggests that increasingly, consumers consider online video a full replacement for traditional or virtual multichannel TV services.

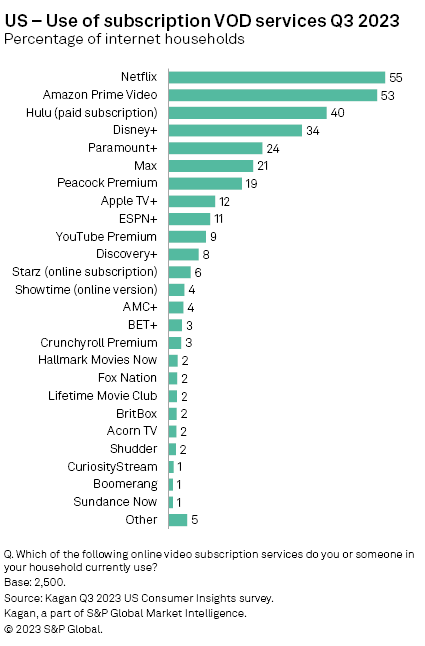
Netflix and Amazon Prime Video continue to be the top two SVOD service providers in the US, each with over half of total internet households subscribing to their services. Nearly three-quarters (73%) of Netflix users and 52% of Amazon Prime Video users said they access the service either daily or multiple times each week. Only 27% of Netflix users indicated they access the service once a week or less.
Hulu and Disney+ are also very popular with subscriber households, being watched by 40% and 34% of respondents, respectively. Paramount+, MAX and Peacock Premium comprise a third tier of SVOD services that are used by about 20% of US households. Apple TV+ (12%) and ESPN+ (11%) are top among the long tail of SVOD service providers. The survey found that on average, US internet households use approximately three SVOD services.

The survey found that on average, US internet adults spend more than four hours each day watching TV/video content, behavior that has remained very consistent throughout the pandemic and post-pandemic years. Overall, 60% of live TV viewing is spent watching traditional live TV broadcast programming, compared to 40% spent streaming live TV content. Similarly, 57% of daily VOD viewing hours is spent watching SVOD, while free online video represents the remaining 43% of VOD hours.
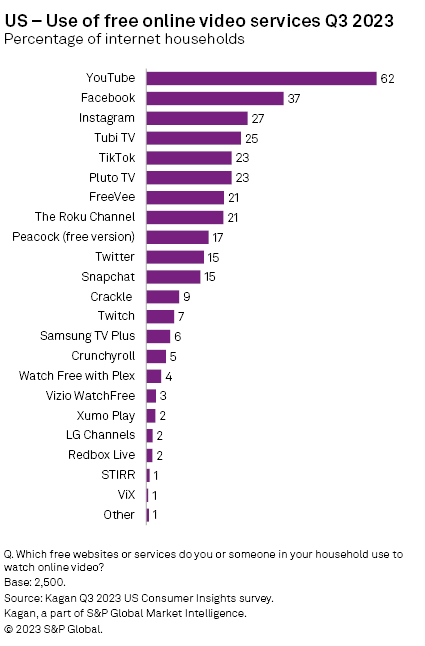
Overall, 84% of US internet adults report watching free, ad-supported TV video content. YouTube is by far the most popular source of free online video content in the US with nearly two-thirds (62%) of internet adults reporting use of the service. User-generated content services, such as Facebook (37%), Instagram (27%) and TikTok (23%) are also popular as well as more traditional TV programming services such as Tubi TV (25%), Pluto TV (23%), The Roku Channel (21%) and Amazon's FreeVee (21%). The survey found that US internet households use just over three free video services on average.

The latest Kagan US Consumer Insights survey also shows that other digital entertainment activities, such as cinema attendance and online video purchases/rentals, grew slightly year over year, while the use of online music services experienced a modest decline. The survey also found that gaming remains strong with approximately six out of 10 internet adults playing video games. Nearly two-thirds (64%) of internet adults reported playing mobile games, and 57% said they played PC or console-based video games within the past three months.

To submit direct feedback/suggestions on the questions presented here, please use the "feedback" button located above, directly under the title of this article. Note that while all submissions will be reviewed and every attempt will be made to provide pertinent data, Kagan is unable to guarantee inclusion of specific questions in future surveys.
Consumer Insights is a regular feature from Kagan, a part of S&P Global Market Intelligence.
This article was published by S&P Global Market Intelligence and not by S&P Global Ratings, which is a separately managed division of S&P Global.