Featured Topics
Featured Products
Events
S&P Global Offerings
Featured Topics
Featured Products
Events
S&P Global Offerings
Featured Topics
Featured Products
Events
S&P Global Offerings
Featured Topics
Featured Products
Events
Financial and Market intelligence
Fundamental & Alternative Datasets
Government & Defense
Banking & Capital Markets
Economy & Finance
Energy Transition & Sustainability
Technology & Innovation
Podcasts & Newsletters
Financial and Market intelligence
Fundamental & Alternative Datasets
Government & Defense
Banking & Capital Markets
Economy & Finance
Energy Transition & Sustainability
Technology & Innovation
Podcasts & Newsletters
Research — 17 Aug, 2023

By Tony Lenoir
Annualizing US energy production based on currently operating and planned capacity suggests that majority carbon-free generation is on the horizon. That said, renewables have a long way to go to dislodge legacy fuels from the top spots, let alone becoming reliability contribution anchors. Complicating matters, hurdles are mounting on the US' path to net-zero, including inflation and rising costs of financing, dependence on outside markets for critical green energy materials and components, and perhaps the changing climate itself.

Modeled generation output based on currently operating and planned capacity suggests that the US is on a path to generating more than 50% of its electricity through carbon-free sources, with the steadily expanding renewable generation fleet complementing nuclear and hydropower.
But emerging challenges — some of which US green energy developers have little control over — could slow momentum. This includes a margin-pressuring inflationary environment and a nonnegligible reliance on outside markets for supplies critical to renewable energy development.
Efforts to remedy the latter are being implemented, however, notably legislation promoting the onshoring of green energy manufacturing, including the Inflation Reduction Act of 2022. According to a June 6, 2023, report by Rocky Mountain Institute affiliate Canary Media, more than $70 billion in new US clean energy manufacturing investments have been announced since the signing of the law in August 2022.

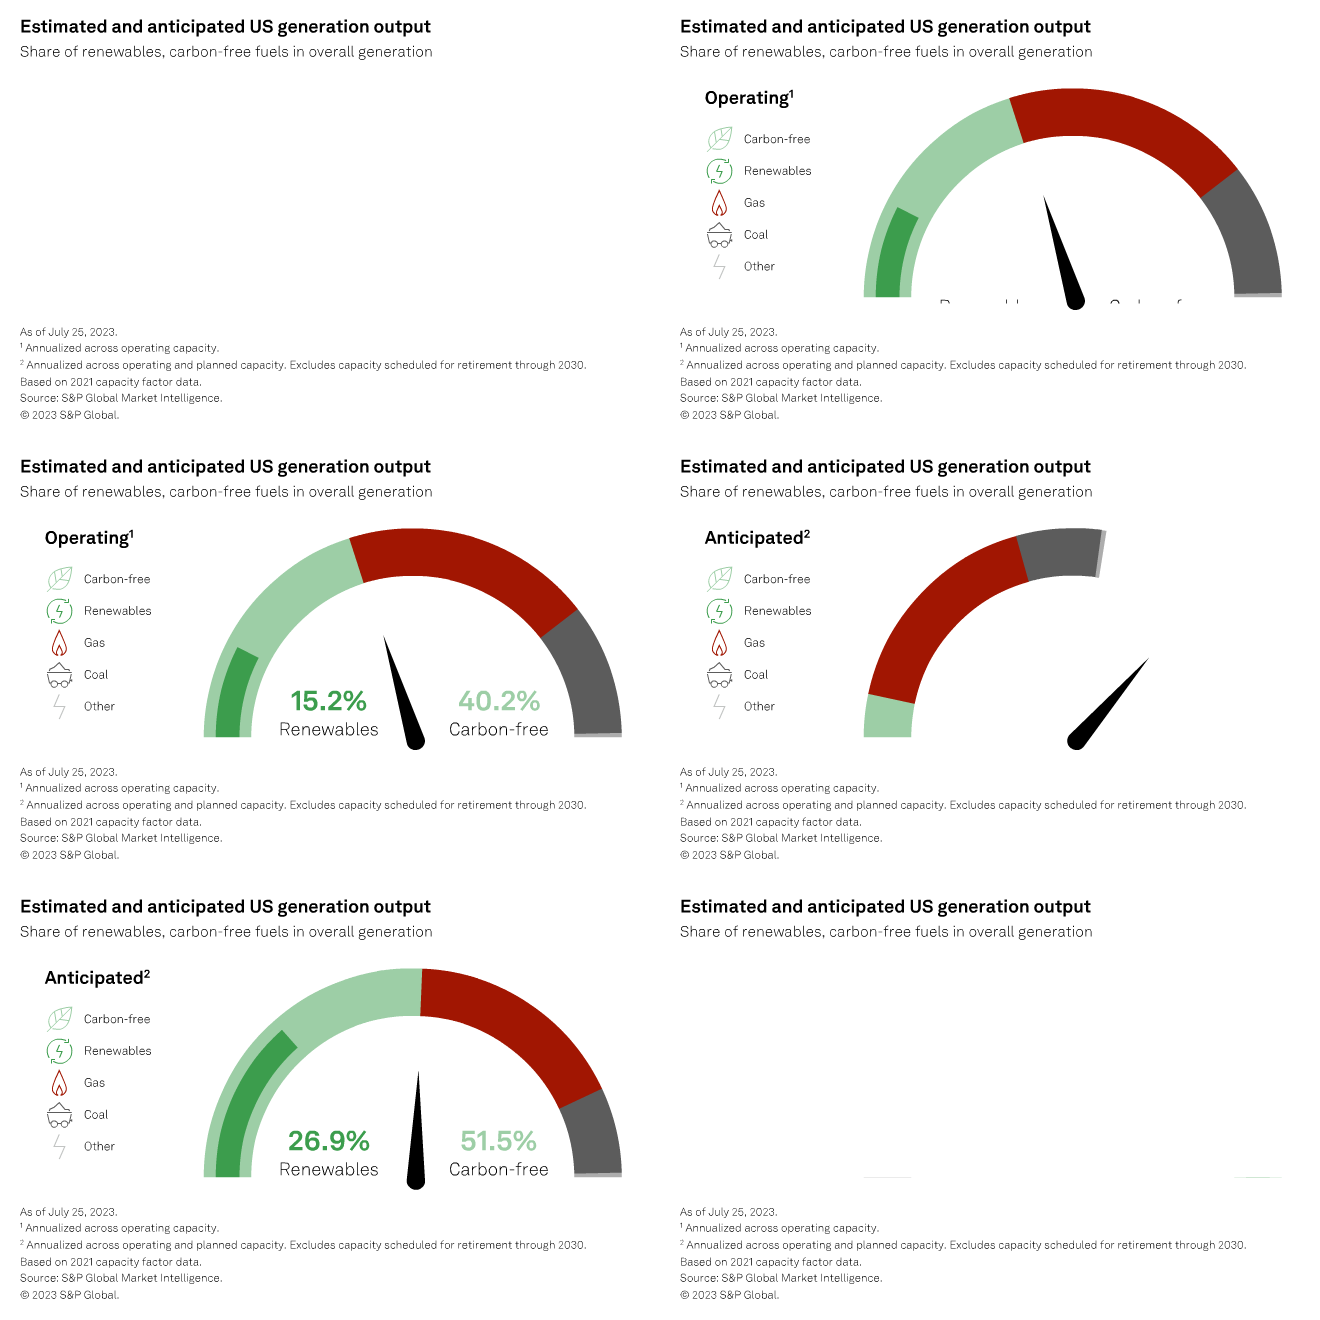
Our analysis suggests renewable energy — biomass, geothermal, solar and wind — comprises 15.2% of annualized US electricity production based on the country's current utility-scale generation fleet, with the figure set to approach 27% based on capacity in the pipeline. Including nuclear and hydroelectricity, US carbon-free generation comes in at more than 40.2% of the total, with prospects to break the 50% mark based on anticipated capacity additions and retirements.

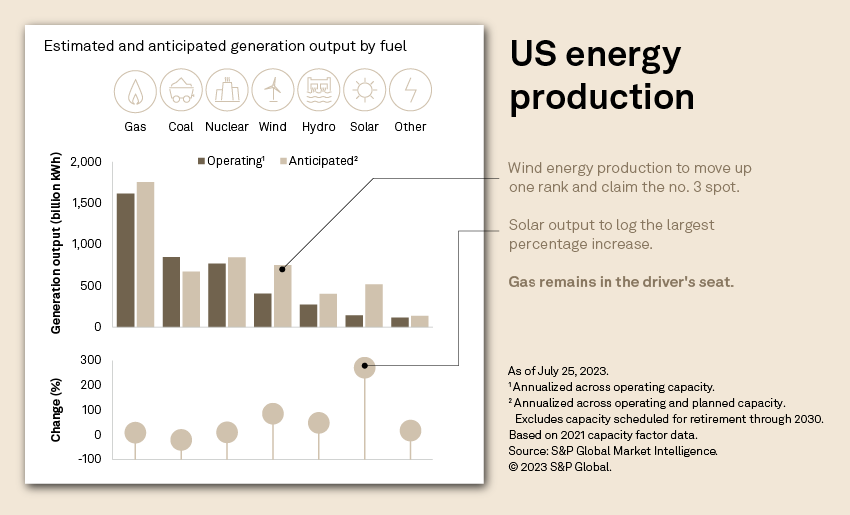
Based on these probable changes, wind energy production is to move up one rank in the generation output leaderboard and claim the number three spot. Utility-scale solar production is to log the largest percentage increase, up 271%, but gas ultimately remains in the driver's seat, accounting for more than a third of US power generation across our scenarios. Coal, which allowed for industrialization, remains on a seemingly inexorable downward trajectory, falling from the number two generation-contribution spot to number four.
Thirty-three US states are on course to majority CO2-free power production. Currently, 18 states are part of this club based on operating capacity. The proportion of renewables in overall generation output is to remain under 50% in most states, but this pool is also expanding, to an anticipated 10 from only two states now, with the volume of proposed green energy projects suggesting sustained momentum. Commodity Insights' June 2023 deep-dive into US interconnection queues shows 1.9 TW of renewable energy capacity undergoing impact studies for grid connectivity.
This reflects the determination at the highest echelons of government to enable the energy revolution, mainly through highly accommodative legislation, notably the Inflation Reduction Act. These renewable energy objectives, for the most part, stem from environmental and energy security considerations — themselves creating challenges for the US in its pursuit of green energy objectives in the form of shifting geopolitics.
The image below is a video presentation; please click on the image to access controls to play, pause or navigate to specific video frames. To view the video in full screen, please click the square at the bottom right of the video player; to exit full-screen view, please click "x" or press the "Esc" key.

The US remains highly dependent on outside markets for materials and components critical to the renewable energy sector. S&P Global Market Intelligence data shows the US is planning to add nearly 249 GW of capacity to its existing 81 GW large-scale solar generation fleet. In comparison, the US operates a little over 147 GW of wind capacity, with an additional 131 GW in the works. But US photovoltaic production capacity, though boosted by the Inflation Reduction Act, pales in comparison to China's.
US Energy Department data compiled by Market Intelligence in a May 23, 2022, report shows China dominating the global solar market supply chain, controlling more than 95% of the world's manufacturing capacity for ingots and wafers, 72% for polysilicon, 81% for cells, and 77% for completed panels.
Amid shifting trade relations with the US, China announced July 3 that it would restrict exports of two metals used in semiconductor and photovoltaic panel manufacturing — gallium and germanium — effective Aug. 1. Such export limitations and potential restrictions on other minerals critical to the production of solar panels could also affect US energy transition plans.
In addition to the semiconductor industry challenges, the US is fighting inflation — a battle that has led the US Federal Reserve to raise the benchmark federal funds rates 11 times in its last 12 Federal Open Market Committee meetings to now range between 5.25% and 5.5%. In a press conference following the latest interest step-up announcement July 26, Fed Chairman Jerome Powell signaled further monetary hawkishness. Both manufacturing and financing costs are squeezing margins across the renewables sector, notably the wind space, compelling developers to take a second look at planned projects.
Climate itself could get in the way of green energy generation. For instance, second-quarter US wind speed data shows that significant negative deviations from the norm cannot be excluded. On the solar front, summer months are popularly associated with high levels of photovoltaic energy generation, but various studies have shown that extreme heat can adversely impact the performance of solar panels, with loss in efficiency ranging from 10% to 25% in some cases.
June 2023 was the hottest month on record, according to National Oceanic and Atmospheric Administration, with the average global temperature 1.89 degrees F (1.05 degrees C) above normal. In a July 27 news release, the EU's Copernicus Climate Change Service said the first three weeks of July constituted the warmest three-week period ever recorded.
Loss in production efficiency due to extreme weather would compound the already comparatively low capacity factors and further pose the question of reliability contributions. In 2021, the average capacity factor for US solar projects came in at 24.4%. For wind projects, the metric stood at 34.2%.

Modeling the evolution of overall US generation output by fuel type based on currently operating and planned capacity involved a multistep process.
For the operating generation fleet, we estimated production based on S&P Global Market Intelligence's power-plant-specific 2021 capacity factor data when available. For generation in planning, or operating plants for which 2021 capacity factor data was not available, we relied on weighted average capacity factors by fuel type and county.
We then aggregated the energy production results at the state and national levels. With 2030 being the most distant known online year for projects in various stages of development, the analysis took into consideration scheduled retirements of non-renewables plants from 2023 through 2030 at the time of writing. Note that a significant number of planned projects do not have an anticipated online year.
Data visualization by Rameez Ali and Joseph Reyes.For wholesale prices and supply and demand projections, see the S&P Global Market Intelligence Power Forecast. Regulatory Research Associates is a group within S&P Global Commodity Insights.S&P Global Commodity Insights produces content for distribution on S&P Capital IQ Pro.This article was published by S&P Global Market Intelligence and not by S&P Global Ratings, which is a separately managed division of S&P Global.