Research — Aug 20, 2026
US interconnection queue reforms make impact as withdrawn capacity tops 1.8 TW

By Adam Wilson
US interconnection queues have shifted sharply from a story of unchecked intake to one of filtering, reprioritization and attrition. Cumulatively, the seven independent system operators have dropped 460 GW from their interconnection queues between 2023 and 2026, led by major queue reform efforts from California Independent System Operator, PJM Interconnection and New York Independent System Operator. Aggregated withdrawn queues from the seven ISOs and over 30 non-ISO utilities for projects that entered queues in 2020 or later total over 1,800 gigawatts, with renewables and battery storage projects making up the bulk of removed projects.
Download the 2026 US interconnection queues analysis and its Excel companion.
Active queues in transition
US interconnection queue capacity has undergone dramatic shifts in the past three years, but these shifts have not occurred uniformly across regions. In ISOs such as CAISO and PJM — where queue reform, study freezes and stricter readiness rules have forced projects to revalidate their status — reductions have been dramatic. Electric Reliability Council of Texas and Southwest Power Pool, on the other hand, show growth or net expansion over the period. The common policy backdrop is FERC Order 2023, approved in July 2023, which sought to modernize generator interconnection by moving transmission providers toward cluster studies, firmer timelines, readiness requirements, deposits and withdrawal penalties.
Active queue capacity in CAISO shrank by roughly half in three years, to 182 GW in 2026 from 363 GW in 2023. The largest reductions came in battery storage (to 43 GW from 146 GW) and wind (to 2 GW from 29 GW), while hybrid capacity — mostly in the form of solar-plus-storage — remained the dominant category, despite shedding nearly 49 GW since 2023. This pattern aligns with CAISO's reform approach, which prioritizes projects with stronger readiness and better alignment with available or planned transmission, rather than allowing the queue to function as an open-ended placeholder for speculative projects.
ERCOT moved in the opposite direction, with active queue capacity rising to 421 GW as of June of this year, from 245 GW in 2023. Hybrid projects increased 85% to 138 GW, while battery storage jumped 74% to 116 GW. Natural gas showed the largest percentage increase, however, spiking to 49 GW in 2026, a 4.5x increase from the 2023 level. ERCOT does not fall under FERC's regulatory jurisdiction and, therefore, is not subject to FERC Order 2023.
ERCOT's queue management approach involves incremental process improvement, rather than federally mandated cluster-study overhauls. Further, Texas is emerging as a hub for data center growth, forcing energy providers to accelerate energy development, largely in the form of natural gas. As a result, ERCOT's queue has continued expanding while most other ISOs have shrunk. That said, ERCOT is coming under political pressure to audit its growing queue.
The Midcontinent Independent System Operator's queue has also seen a net increase in capacity over the past three years. Its queue growth is more modest than ERCOT, however, rising 12% to 271 GW in 2026 from 241 GW in 2023. Solar remained the largest active category in 2026 at 117 GW, followed by battery storage at 50 GW, wind at 37 GW and natural gas at 35 GW. Queue reform in MISO has centered on cycle-based processing, queue caps, automation, alignment with FERC Order 2023, the Expedited Resource Addition Study, and Joint Targeted Interconnection Queue (JTIQ) work with SPP. These reforms indicate an effort to move away from open-ended serial processing while maintaining expedited pathways for projects deemed necessary for grid reliability.
PJM recorded the most dramatic contraction among the seven ISOs, with active queue capacity plummeting to 31 GW in June from 424 GW in 2023. Over 158 GW of solar capacity was dropped from the queue, along with 101 GW of battery storage. The scale of the decline corresponds with PJM's "first-ready, first-served" interconnection reform and its temporary closure of the queue to new requests beginning in 2022 while it worked through a seemingly unmanageable backlog. PJM's queue appears to be at a nadir, however, as 715 new projects totaling more than 200 GW of capacity qualified for study in the first cycle of PJM's reformed interconnection process.
NYISO's active queue saw a stark drop in capacity, falling to 46 GW in 2025 from 136 GW just one year earlier. Cumulative capacity dropped again in 2026 to 26 GW. Driven largely by significant scalebacks in offshore projects, wind declined 88% to 7 GW in 2026, while battery storage dropped by more than half to 11 GW. NYISO reformed its process by launching a cluster-study model to comply with FERC Order 2023, replacing a more individualized study structure with clustered evaluation.
After peaking at 42 GW in 2024, ISO New England's interconnection queue fell to just over 17 GW as of the 2026 report, with wind and battery storage both seeing notable declines. ISO-NE's generator queue was not as backlogged as others, but cumulative capacity still declined as federal policies hindered offshore wind construction, forcing developers to pull back on project planning. The ISO is complying with FERC Order 23 by implementing cluster-study procedures, holding scoping meetings to define project information, and carrying out studies and necessary interconnection upgrades.
SPP's active queue also saw a net increase in capacity between 2023 and 2026, rising to 172 GW in 2026 from 131 GW in 2023, although capacity peaked at 188 GW in 2025. Solar is the leading technology in SPP's queue at nearly 40 GW. Technologies are fairly evenly split in its queue, however, with battery storage at 37 GW, natural gas at 34 GW and wind with just over 31 GW. The ISO has continued reforms to the generator interconnection queue while also using fast-track reviews as an interim tool, in addition to efforts related to the JTIQ framework with MISO.
Withdrawn capacity since 2020
Examining capacity withdrawn from interconnection queues across the country highlights the remarkable level of solar and battery storage projects that entered queues since 2020. Over 550 GW of hybrid capacity, largely solar-plus-storage projects, was removed from queues in the past six years. Just over 460 GW of stand-alone battery storage and 419 GW of solar capacity were shed from queues during this period as well. Cumulatively, over 1,800 GW of capacity was withdrawn or terminated since 2020.
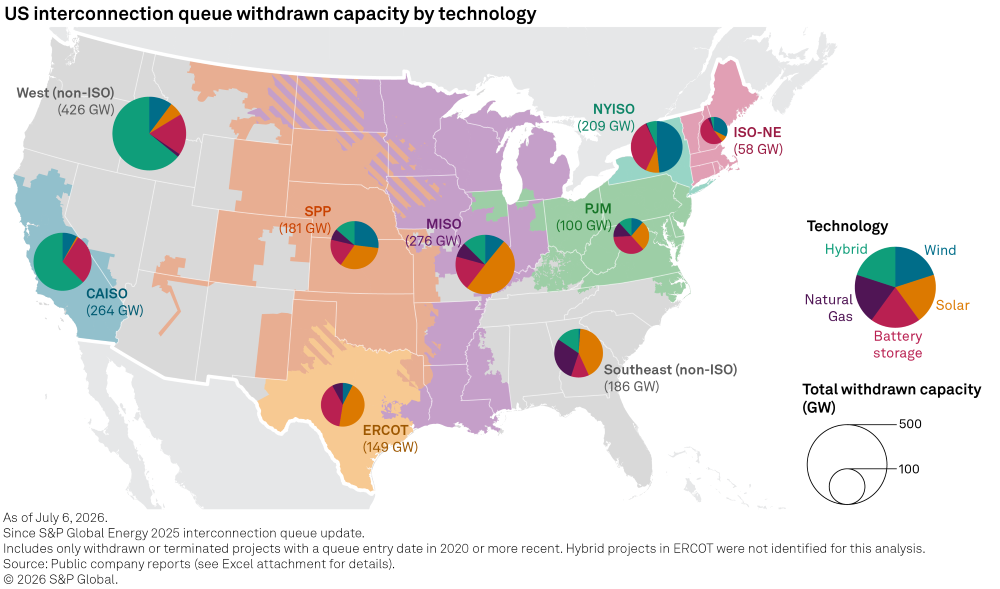
CAISO shed more than 260 GW of capacity, just from projects that entered the queue in 2020 or later. Hybrids made up the largest share at 165 GW, followed by battery storage at 75 GW. Hybrids and stand-alone storage still dominate CAISO's active queue, reflecting the overwhelming surplus of such projects in CAISO's cluster 14 and 15 queues. CAISO's reforms emphasize readiness, scoring and alignment with transmission availability, leading to the high number of speculative projects being withdrawn by developers. Additionally, many projects were terminated by CAISO due to not being resubmitted after the cluster 15 reopening.
ERCOT recorded 149 GW of withdrawn or terminated capacity between 2020 and 2026. Solar led the withdrawals at 67 GW, followed by battery storage at 59 GW. Because ERCOT's active queue is still expanding, the withdrawn data should be read less as evidence of a broad queue purge than as churn within a very active development market.
MISO's withdrawn total ranks second only to the non-ISO West, with 276 GW removed from the ISO's queue since 2020. Reflecting the active queue, stand-alone solar accounts for nearly half of withdrawn capacity in MISO, with stand-alone storage and hybrid systems ranking a distant second and third, respectively, in withdrawn capacity. MISO's sizable withdrawn queue — along with a generally growing active queue (also ranking second only to ERCOT) — underscores the level of developer interest in the region.
Like its active queue, PJM's withdrawn queue is comparatively modest, especially considering its size. At 100 GW, only ISO-NE has a smaller withdrawn queue. Stand-alone battery storage (36 GW) and solar (27 GW) combined account for over 60% of withdrawn projects in PJM. PJM is arguably undergoing more significant queue overhauls than any other ISO, leaving a large fleet of projects in flux. Its generator queue is clearly in a transition period, making it difficult to draw firm conclusions about the development pipeline.
Given NYISO's small load, its withdrawn queue totals an outsized 209 GW — the fourth-highest among the nine designated regions in this analysis. Thanks, in part, to a substantial retreat in offshore wind interest, wind accounts for 101 GW of this capacity, with stand-alone battery storage making up another 75 GW. These two asset classes alone make up 84% of NYISO's withdrawn queue.
ISO-NE had 58 GW worth of projects withdrawn or terminated since 2020. Battery storage represented the largest withdrawn category at 31 GW, followed by wind — primarily offshore wind — at 19 GW. This technology mix mirrors ISO-NE's active queue, where wind and storage were the largest categories in 2023 and remained central to the queue, even after these removals. ISO-NE's work associated with FERC Order 2023 revealed which projects can tolerate more defined study timelines, readiness obligations and upgrade-cost exposure while filtering out redundant or speculative entries.
Over 180 GW of capacity has dropped from SPP's interconnection queue since 2020. Similar to its active queue, the technology split is more evenly distributed than in other regions. Stand-alone solar (59 GW) and wind (49 GW) rank first and second, respectively, among technologies removed from the active queue. Given SPP's queue is still generally expanding and with a consistent technology breakout to the active queue, the withdrawn queue seems more indicative of "business-as-usual" activities, rather than a significant overhaul that other ISOs are carrying out.
The largest withdrawn total in the dataset is the non-ISO West, with 426 GW withdrawn or terminated from projects entering queues in 2020 or later. Similar to CAISO, hybrid projects dominated the non-ISO West withdrawn total at 273 GW, with stand-alone battery storage a distant second at 78 GW. As is the case in other regions, the technology breakout of withdrawn projects largely mirrors the breakout in the active queues across the non-ISO West, indicating project removals are mostly shedding surplus capacity of preferred technologies, rather than a substantive shift in development strategy.
The non-ISO Southeast had 186 GW withdrawn or terminated, with solar leading at 78 GW then natural gas at 55 GW. Unlike other regions, the Southeast has undergone a significant shift in queue technology breakout since 2023. Solar once accounted for over half the region's interconnection queue capacity while natural gas made up just 16% of the total. Those shares have flipped, with natural gas now accounting for nearly half (46%) of the Southeast's cumulative total queue capacity, while solar's share has plummeted to just 22%.
The past four years show an interconnection system in transition. In some regions — especially PJM, NYISO, CAISO and ISO-NE — active queues have contracted as cluster studies, readiness rules, deposits and withdrawal penalties reshape which projects remain active. In others, especially ERCOT and SPP, active capacity has continued to expand, despite ongoing reforms and high project turnover. Analysis of withdrawn capacity underscores that interconnection queues are not a construction forecast but rather a screening ground where technology demand, transmission constraints, study reform, project finance and political influence increasingly determine which proposals advance.
S&P Global uses generative AI to create content in accordance with our Terms of Use. (Terms of Use with https://www.spglobal.com/en/terms-of-use)
Data visualizations by Shirley Gil and Oscar Solano.
For wholesale prices and supply and demand projections, see the S&P Global Market Intelligence Power Forecast.
Regulatory Research Associates is a group within S&P Global Energy.
S&P Global Commodity Insights produces content for distribution on S&P Capital IQ Pro.
Tony Lenoir contributed to this article.
This article was published by S&P Global Market Intelligence and not by S&P Global Ratings, which is a separately managed division of S&P Global.