Research — July 17, 2026
Gold mine feasibility studies: The discipline of through-the-cycle pricing

By Jason Holden
This is the second article in a three-part series examining base-case commodity price assumptions used in mining feasibility studies versus prevailing spot prices. The analysis draws on 1,773 base-case gold price assumptions from studies published between 1998 and 2026, benchmarked against the London Bullion Market Association (LBMA) annual average gold prices. It examines the consistency and limits of the gold industry's through-the-cycle pricing discipline. Part one of the series covered copper, while part three will cover lithium.

➤ Development-stage gold companies have a massive discount embedded in current studies, representing a substantial cushion of unaccounted value.
➤ If current gold prices hold, the actual project net present values and internal rates of return will vastly outperform the base cases presented in current feasibility literature.
➤ Early-stage preliminary economic assessments, which are more optimistic, dominate study volumes. Therefore, the aggregate average study price ($2,946 per ounce in 2026) is higher than it would be if adjusted solely for full feasibility studies.

The gold dataset is the largest of the three commodities analyzed, reflecting gold mining's position as the most active commodity segment of the global mining industry, both in the number of active projects and in the size of exploration budgets. In this analysis, 675 (38%) of the studies are preliminary economic assessments (PEAs), 308 (17%) are prefeasibility studies, 515 (29%) are full feasibility studies and 275 (16%) are mine plans. Compared to copper, the relatively high proportion of full feasibility studies reflects gold's greater capital market maturity and the volume of gold projects that have advanced to the bankable study stage. This factor affects interpretation because the study type mix affects price assumption behavior. PEAs, often produced by junior companies seeking to demonstrate project attractiveness, can embed more optimistic assumptions. Meanwhile, full feasibility studies, which underpin financing decisions, tend to be more conservative.
..
|
2004–12 bull market: Refusing to chase the rally
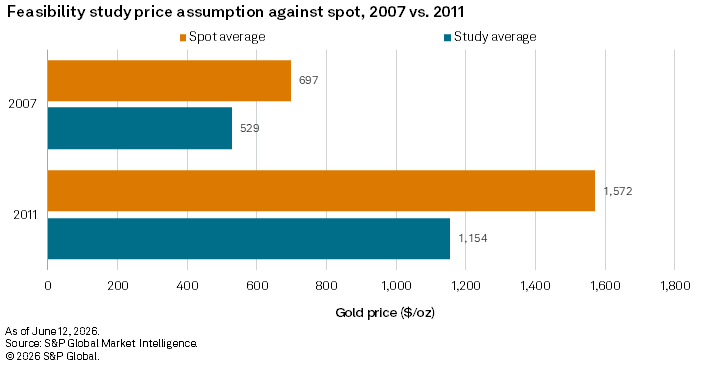
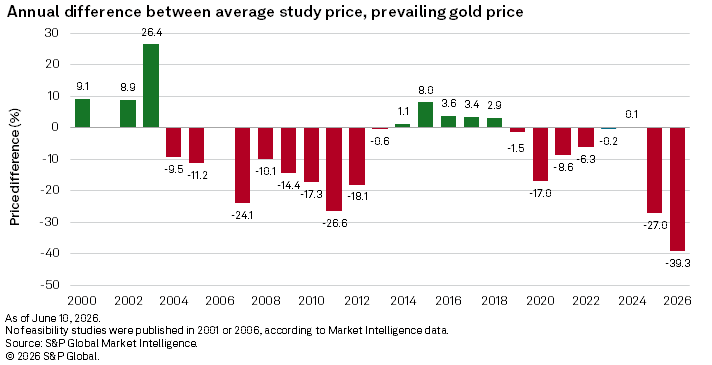
Gold feasibility study assumptions during the 2004–2012 bull market display the clearest and most consistent pattern in the dataset: They ran 10%-27% below the spot price for nine consecutive years. In 2007, when the LBMA spot price averaged $697/oz, study assumptions averaged $529/oz — a 24% discount. By 2011, at the height of the bull market with the spot price at $1,572/oz, assumptions had risen to $1,154/oz, but the discount had deepened to 27%. This is the gold industry's through-the-cycle pricing discipline in action. Rather than anchoring to the prevailing spot price, companies applied long-run price assumptions that reflected where they expected gold to trade over the life of a multidecade mine. The approach is rational — a mine sanctioned on $1,572/oz gold that subsequently faced a correction to $1,160/oz would have been under pressure — but it also meant that study economics published during the bull market consistently understated project value at prevailing prices.
2013–19: Recalibration and a quiet vote for recovery
After gold peaked in 2011 and entered a multiyear decline toward $1,160/oz by 2015, assumptions and spot price converged rapidly. By 2013, the gap had essentially closed, and from then to 2019, assumptions tracked within 5% of the spot price in either direction. A modest period of above-spot assumptions emerged in 2015 and 2016, when study averages of $1,253/oz and $1,294/oz were 8% and 4% above a declining spot price, respectively, indicating companies were pricing in a degree of recovery. This mirror image of the bull-market discount — a slight premium during troughs — is consistent across all three commodities in this series and reflects the reluctance to embed cycle lows into the economics of projects with productive lives extending well beyond the current price environment.
2020 onward: COVID-19 surge, convergence and the current divergence
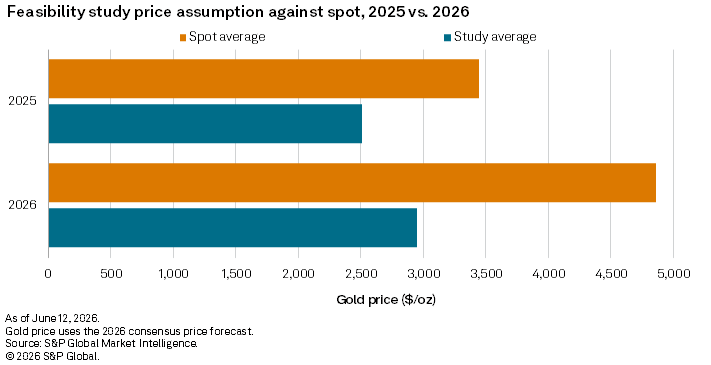
The gold price surge of 2020 triggered a fresh round of conservatism. Assumptions lagged spot price by 17% in 2020, falling to 6% and 9% in 2021 and 2022, respectively. By 2023 and 2024, the gap had closed again almost entirely: Study assumptions sat within $1/oz of actual annual average spot prices in both years, an exceptional degree of alignment that had not been seen during any prior rising-price period. The most recent data is where the story becomes most significant. As gold surged to an annual average of $3,444/oz in 2025 and has averaged $4,817/oz in the year to date in 2026, study assumptions have not kept pace. Studies published in 2025 used average assumptions of $2,513/oz, 27% below spot price, and 2026 studies have used $2,946/oz, 39% below a market that has moved to an entirely new price level. This is the largest single-year divergence in the gold dataset and suggests that the through-the-cycle discipline that served the industry well during the 2004–12 cycle is once again creating a substantial gap between reported project economics and the value implied by current market prices.
Across the dataset, full feasibility studies tend to use more conservative assumptions than PEAs in bull markets, consistent with the greater scrutiny applied to bankable documents. In the current environment, where PEAs are driving much of the study volume for early-stage gold projects, the mix effect modestly elevates the aggregate average assumption. The directional conclusion is unchanged, however: Industry assumptions remain well below prevailing spot prices. For investors evaluating gold project economics today, the conservatism embedded in feasibility studies represents a significant upside, provided current price levels are sustained.
This article was published by S&P Global Market Intelligence and not by S&P Global Ratings, which is a separately managed division of S&P Global.