ECONOMICS COMMENTARY — 08 Jul, 2026
Global growth hits highest since February amid strengthening service sector expansion

The pace of global economic growth edged higher in June, according to worldwide PMI survey data from S&P Global. Although still running below the pace seen earlier in the year, output rose globally at the fastest rate since the outbreak of war in the Middle East. However, the structure of growth showed signs of changing amid the improved newsflow out of the Middle East: the recent strong manufacturing expansion slowing amid reduced precautionary stock building, while services growth revived – notably for consumer-facing industries – amid the recent drop in energy prices.
Global PMI edges higher in June
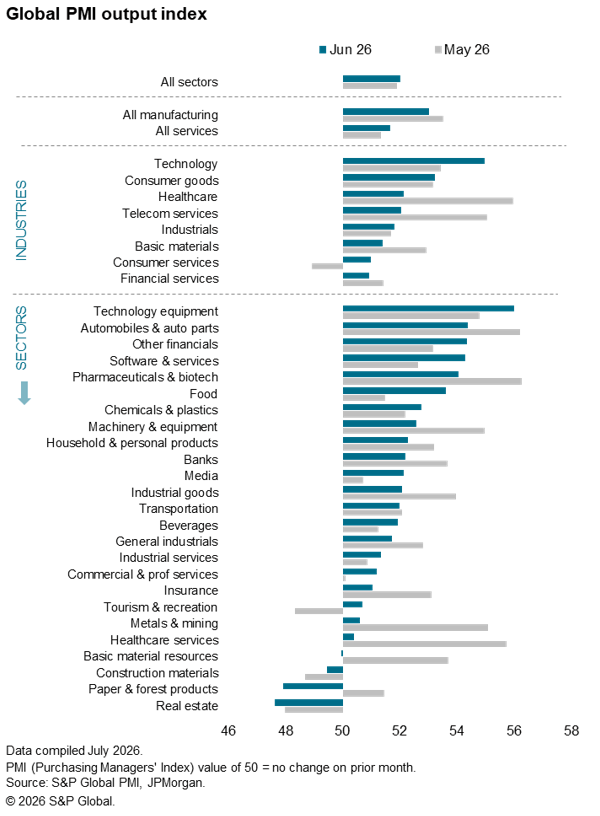
Survey data indicated that global economic growth picked up in June amid improved news out of the Middle East. The J.P.Morgan Global Composite PMI Output Index ticked higher for a third successive month, up from 51.9 in May to 52.0 in June, to reach its highest since February – just prior to the outbreak of the conflict.
The data therefore add to signs that business activity growth bottomed out back in March and has since shown encouraging resilience. The PMI readings are broadly indicative of global GDP growth running at an annualised 2.5% rate over the second quarter, down from around 3% at the start of the year but only modestly below the long run average of 2.9% seen since 1998.
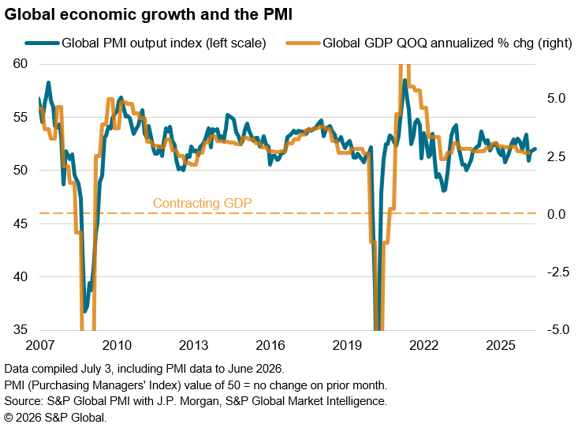
June’s improved data were collected over a period in which oil prices fell sharply and tensions eased in the Middle East following a ceasefire and subsequent signing of an MOU between the US and Iran. Trade flows also picked up through the Strait of Hormuz, albeit continuing to run well below volumes seen prior to the conflict.
Sector rotation
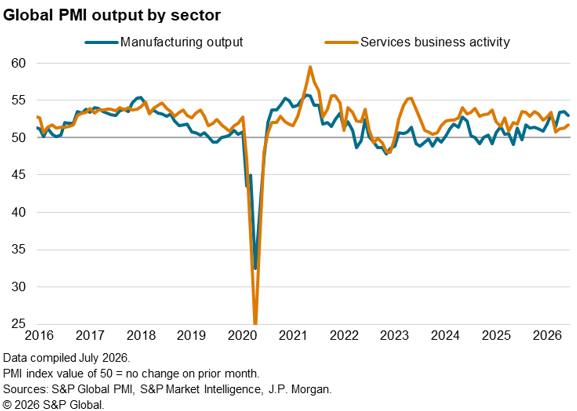
Although the overall change in the headline global PMI output index was only marginal in June, shifting sectoral contributions to growth were more notable. At the broadest level, manufacturing – which has notched up its best performance for five years over the second quarter as a whole – lost some growth momentum in June, the latest expansion being the slowest since March. In contrast, the services sector – which had conversely seen a marked slowing in growth on the outset of the conflict – enjoyed its strongest expansion since February in June.
Two key drivers of change identified
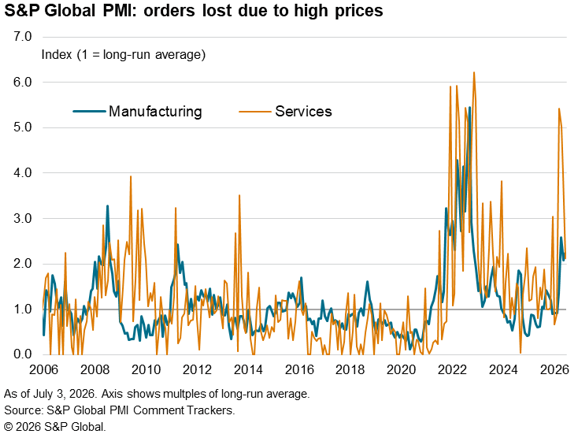
High cost pressures, principally reflecting the surge in energy prices seen up to May, has led to softer sales growth across both manufacturing and services as customers have pushed back on rising prices. This price effect has been especially notable in services but also evident in manufacturing. However, the service sector saw this demand-sapping effect of inflation moderate considerably in June, as cost pressures cooled and selling price inflation slowed thanks to the drop in energy prices.
In the manufacturing sector, the acceleration of growth since the start of the war has been part-linked to precautionary stock building by manufactures and their customers. This has led to greater demand inelasticity in the goods-producing sector relative to services, as customers have often been prepared to pay higher prices to secure supplies. However, we have seen this inventory building boost fade markedly in June. This has contributed to some of the slowing in manufacturing growth seen in many economies.
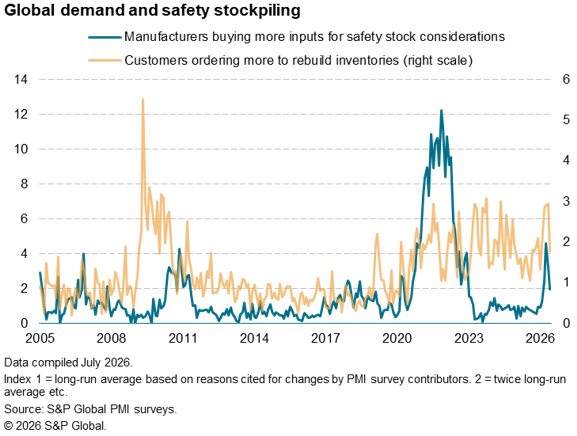
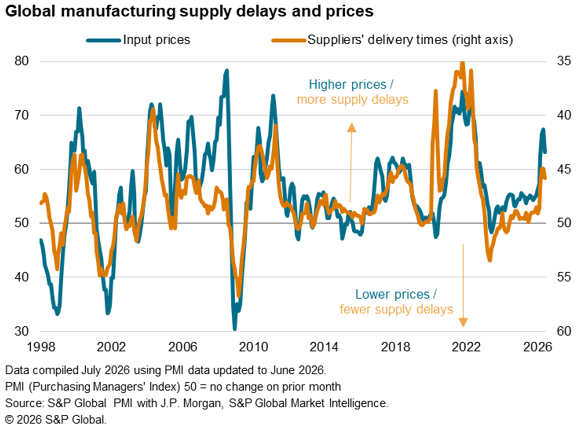
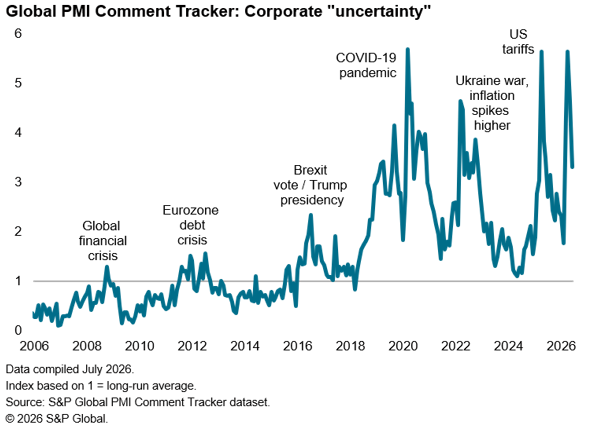
The drop in safety stock building likely reflects a natural reduction in the need to build inventories after several prior months of stock build, but also reflects some softening of supply concerns due to the improved newsflow out of the Middle East in June. We note that not only have supply chain delays moderated but reports of perceived “uncertainty” have also fallen sharply, dropping in June to the lowest since February.
Tracking sector growth momentum
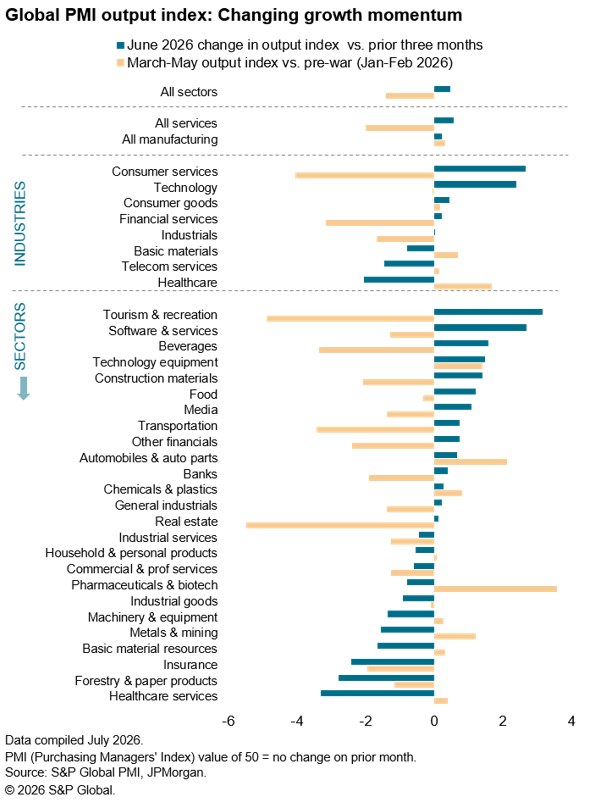
Detailed sector data allow a closer analysis of the impact of these factors. To analyse the changes in growth momentum, we not only look at how the June data compare to the prior three months (March to May), a period characterised by especially heightened geopolitical uncertainty, surging energy prices and widespread supply concerns all stemming from the war in the Middle East, but we also compare this March to May period with the first two months of the year, as this indicates how sectors had been affected by the war.
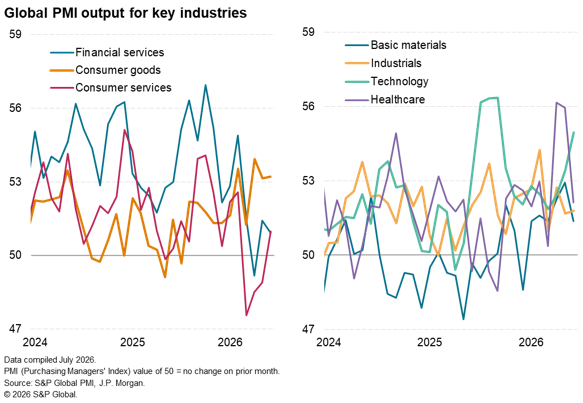
- The strongest improvement in worldwide growth momentum in June was evident in the tourism and recreation sector, which had seen the second-hardest hit to business activity during the March-to-May period. In fact, this improvement helped the wider consumer services industry to also enjoy the strongest rebound, returning to growth in June for the first time since the outbreak of war in February.
- The hardest hit to business activity during the March-to-May period had been real estate, as the surge in inflation led to higher interest rate expectations. With rate hikes coming into force in some economies in June, real estate consequently remained the worst hit sector, contributing to an ongoing drag on the broader financial services sector. Financial services was the worst performing industry in June, stretching the soft patch seen following the outbreak of the war.
- Healthcare, which saw the strongest boost to growth during the March-to-May period, saw the biggest pull-back in growth in June, in part reflecting reduced inventory building in the pharmaceutical and related sectors.
- Similarly, basic materials had benefitted strongly from inventory building amid the heightened war-stress period of March-to-May, but saw an especially marked cooling of growth in June, notably for forestry & paper products and metals & mining.
- Two sectors that fared well during the war and continued to do so in June are consumer goods and technology. These companies reported a boost from inventory building in the war period, but the former has also seen lower inflationary pressures help drive sales in June. Meanwhile, the latter continues to benefit from AI-related investment.
© 2026, S&P Global. All rights reserved. Reproduction in whole or in part without permission is prohibited.
Purchasing Managers' Index™ (PMI®) data are compiled by S&P Global for more than 40 economies worldwide. The monthly data are derived from surveys of senior executives at private sector companies, and are available only via subscription. The PMI dataset features a headline number, which indicates the overall health of an economy, and sub-indices, which provide insights into other key economic drivers such as GDP, inflation, exports, capacity utilization, employment and inventories. The PMI data are used by financial and corporate professionals to better understand where economies and markets are headed, and to uncover opportunities.
Read our latest PMI commentary here.
This article was published by S&P Global Market Intelligence and not by S&P Global Ratings, which is a separately managed division of S&P Global.
Theme
Location
Products & Offerings