


ECONOMICS COMMENTARY — 09 Jun, 2026
The speed of transmission: cost pass-through in emerging vs developed markets

Building on our earlier analysis of Asian PMI® price data, this note extends the framework to examine whether and why the speed of cost pass-through differs between emerging and developed economies. Using the gap between PMI input cost and output price indices as a measure of inflation pipeline pressure, we compare aggregate emerging and developed market trends over the period following Russia’s invasion of Ukraine.
The key finding is striking: emerging market price gaps normalised much faster than those in developed markets. Across the private sector, the EM input-output price gap returned to its historical range in a third of the time it took in developed markets.
This divergence appears to reflect a combination of factors: the Ukraine shock was disproportionately a European gas crisis, developed market services faced stronger second-round wage pressures and some emerging markets were partly insulated through energy-market composition or access to discounted Russian supply. The lesson for the current Middle East energy shock is that headline commodity movements alone are not enough to explain the persistence of inflationary pressures.
Background
Our earlier note, Mind the Gap: Asia’s Inflation Pipeline Has Further to Run, used PMI data to track how long it took for rising input costs to feed through to output prices across 12 Asian economies following Russia’s invasion of Ukraine in February 2022. The main finding was that it took on average 13 months for cost-charge gaps to normalise across Asia’s private sector. Timelines varied considerably across sectors and nations.
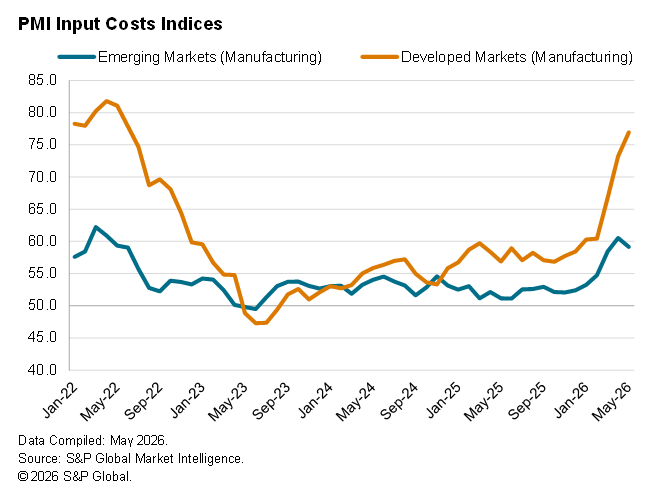
We now turn to an emerging versus developed markets comparison. Looking at manufacturing price indices in isolation, we see notably sharper cost increases in developed economies relative to emerging markets during both the gas shock induced by Russia’s invasion of Ukraine and now due to the restricted movement of vessels in the Strait of Hormuz amid the war in the Middle East. The same is true for factory gate charges.
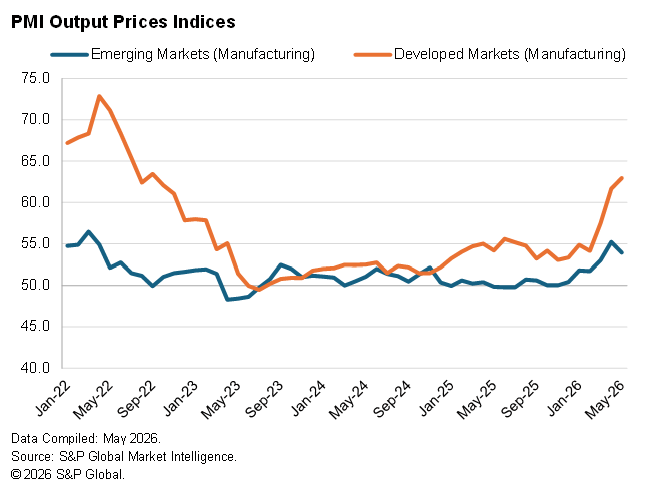
As was the case for Asia, there is evidence of a persistent gap between what companies are paying and what they are charging, suggesting that firms were not raising output prices as broadly or as quickly as input costs were rising (consistent with some margin absorption). This note applies the same methodology as in the previous note to examine whether pass-through speed differs between emerging markets (EM) and developed markets (DM). We also think about what might explain any differences found.
What the PMI data show
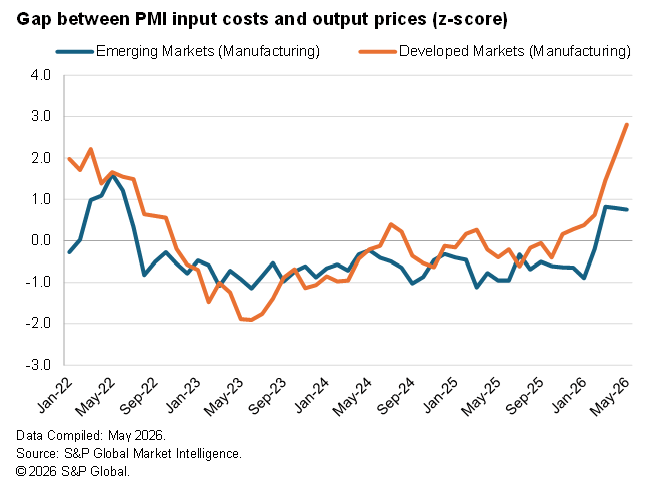
Applying our PMI gap methodology, which tracks the z-score of differences between input cost and output price indices to aggregate emerging market (EM) and developed market (DM) data over the February 2022 to December 2024 analysis window, we find a clear pattern. In emerging markets, the gap between the input costs and output prices indices in manufacturing closed quickly. After peaking in May 2022, the gap normalised within three months. In developed markets, it peaked in March 2022 and the normalisation process took longer (eight months).
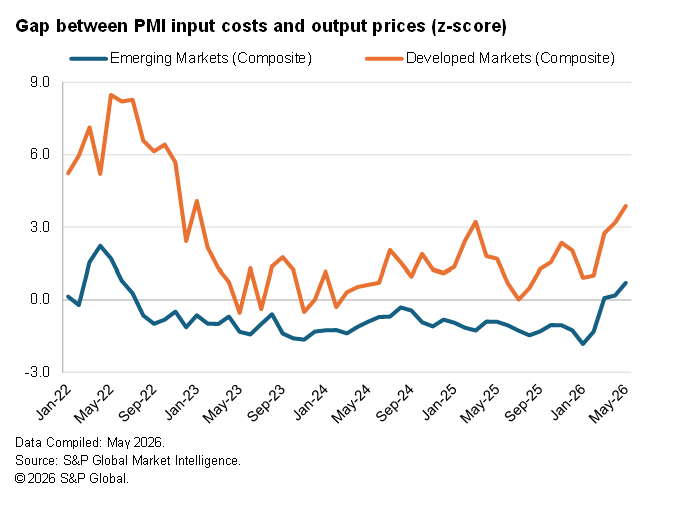
There were stark contrasts between both gap magnitude and timeframes for normalisation between EM and DM service sectors. The former took two months to normalise and for developed economies that was a year-and-a-half. Across the private sector, the timeline for normalisation in DM (12 months) was three times longer than the equivalent EM figure (4 months).
Demand conditions and the speed of pass-through
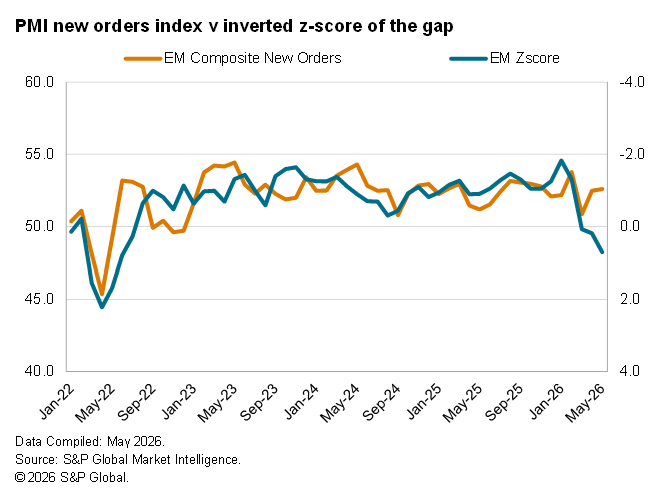
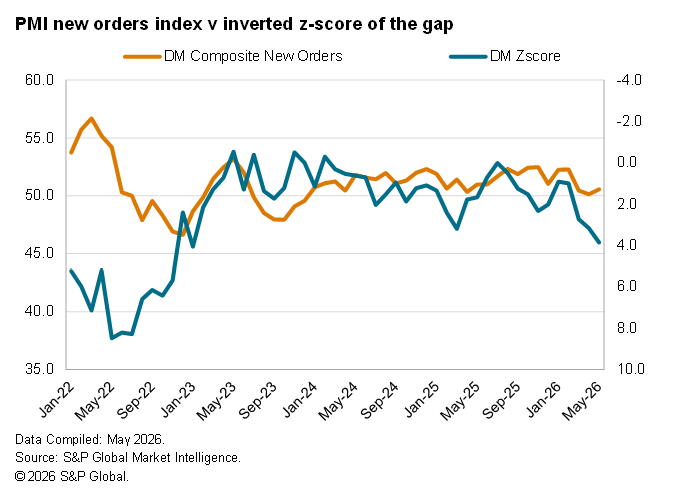
When demand is strong, businesses have more pricing power and tend to pass on costs more quickly. When orders are falling, they absorb costs to protect volumes. We can test this directly using PMI new orders indices alongside our pass-through gap measure (inverted).
In EM, stronger new orders appear to have coincided with faster narrowing of the input-output price gap, consistent with demand-supported pass-through. In DM, the relationship was weaker: firms initially absorbed the shock, but in early-2023 were raising prices sharply even as demand softened, suggesting that margin pressure rather than demand drove the adjustment.
Why emerging markets moved faster: five explanations
1. The shock hit DM differently — it was a gas crisis, not an oil crisis
For developed economies, particularly those in Europe, the shock was disproportionally a natural gas crisis. Russia supplied around 40% of EU gas before the invasion1. Disrupted supply sent European gas prices surging through 2022-2023, with indirect effects feeding through manufacturing supply chains for extended periods.
ECB research shows 10% gas price increases raise headline inflation by 0.6 percentage points, with indirect production effects accounting for three-quarters of the cumulative response after three years². The scale of 2022's gas surge meant DM businesses faced larger, broader and more persistent cost shocks than most EM firms.
Key EM economies depend more on oil than gas, and oil prices began falling in the second half of 2022, making the EM cost shock shorter-lived and consistent with faster pass-through.
2. Some emerging markets were partially insulated or benefited
There's a compositional factor in aggregate EM data worth noting. Russia itself is classified as an emerging market in our PMI aggregates. As both the shock source and major energy producer, Russia's domestic costs weren't hit like energy-importing economies. Meanwhile, some large EM economies were able to access discounted Russian energy, providing some cushion against global energy price surges that DM firms couldn't access. This was nevertheless far from universal across emerging markets.
3. Wages, contracts and the second-round effect in developed markets
Another important difference lies in what followed the initial shock, the second-round wage effects. DM labour markets were exceptionally tight in 2022, partly reflecting post-pandemic rehiring challenges. Europe saw unusually strong employment growth despite subdued output performance. Workers facing surging living costs pushed for pay rises, but DM wage negotiations take time through collective bargaining agreements and legislative minimum wage timetables, creating delayed second-wave cost pressures.
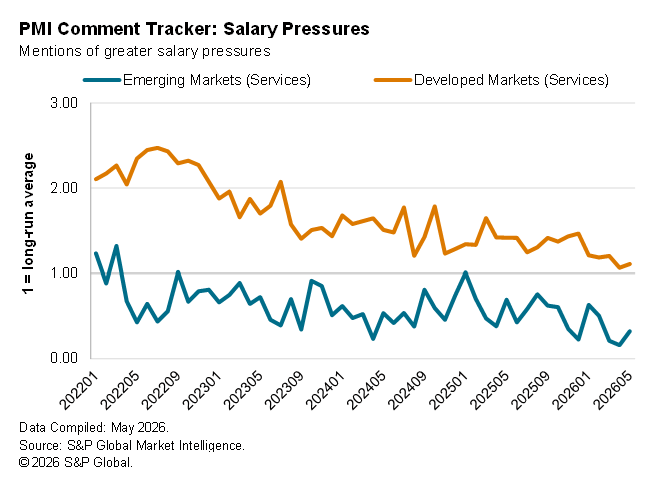
The PMI comment tracker data showed substantial upward pressure on DM service sector costs coming from wages – the primary source of inflation stickiness in DM services – running over double long-run averages.
Across EM economies combined, this second-round effect was limited. Labour markets are more flexible, formal bargaining covers fewer workers and real wage adjustment happens faster.
This likely helps explain why DM service sector pass-through took ten months longer than manufacturing (18 versus eight months), while it was actually shorter across EM (two versus three months). That DM gap partly reflected wage dynamics in services – somewhat insulated from commodity prices but highly exposed to labour costs.
4. EM firms had less capacity to absorb costs
In EM manufacturing, particularly export-oriented sectors, firms cannot absorb significant cost increases for extended periods. They pass costs on quickly or face financial difficulty.
Although developed markets are generally more transparent and institutionally sophisticated, several DM sectors – especially services – have pricing structures that can slow adjustment, including longer contracts, stronger customer relationships and greater capacity to absorb margin pressure.
5. Many EM central banks moved earlier
Several major EM central banks like Brazil and Mexico began raising interest rates in early 2021, well before the Fed's March 2022 tightening. The IMF noted EM central banks moved to get "ahead of the curve" rather than risk destabilising inflation expectations3. Early action kept inflation expectations anchored, reducing incentives for large pre-emptive price rises in contracts and wage negotiations, allowing faster pass-through cycles.
It is important to be precise here: not all EM central banks moved early. The Reserve Bank of India, for instance, kept rates on hold until April 2022, only beginning to hike after the Ukraine shock was already feeding through to domestic prices. The front-loading story is most clearly true for Latin American central banks and some in Central and Eastern Europe – less so for parts of Asia. The aggregate EM picture reflects a mix of early movers and later responders.
What this means for the current episode
The 2026 Middle East energy shock shares some Ukraine features but differs importantly, with direct implications for whether the EM-DM pass-through gap is likely to repeat.
The shock composition differs as it is primarily oil-driven rather than a gas crisis. Pass-through tends to be stronger when inflation is higher, demand more robust and labour markets tighter, whereas today's conditions depart from early-2022. Also, less tight DM labour markets could reduce second-round wage effects that extended DM pass-through previously.
DM service sector stickiness poses a low risk as developed markets in general now face much softer labour market conditions than they did back in 2022.
Implications for monetary policy
The EM-DM divergence has direct, asymmetric implications for policymakers. For EM central banks, faster transmission means cost shocks feed into consumer prices quickly, but pipelines also clear faster. Sustained inflation risk is lower in EM than DM, provided initial policy response is credible. This argues for acting early and decisively when cost pressures emerge.
For DM central banks, structural features slowing pass-through – wage stickiness, services pricing inertia, longer contracting – mean inflation pipelines are harder to clear even after original shocks fade. The 12-month private sector timeline means DM central banks face longer elevated price pressure periods than commodity movements alone would suggest.
The divergence means EM and DM central banks will likely find themselves at different policy cycle points – EM needing to hike sooner before potentially easing earlier, while DM policymakers may need greater patience before they can start looking to ease policy again. That divergence in itself has implications for capital flows, exchange rates and EM asset valuations that are worth monitoring closely.
Methodology
We measure the price gap as the PMI input price index minus the PMI output price index. A positive result indicates that input costs are rising more broadly than output charges. We standardise this gap using pre-shock historical mean and standard deviation (January 2016 to December 2019). Normalisation means the gap has returned to its historical range, it does not necessarily imply full cost pass-through.
References
1 World Economic Forum, “These charts show Europe’s reliance on gas before the war in Ukraine”, November 2022.
2 European Central Bank, “The pass-through to inflation of gas price shocks”, March 2026.
3 PIIE, “Amid wartime disruptions, most emerging-market central banks will follow the Fed”, April 2026.
© 2026, S&P Global. All rights reserved. Reproduction in whole or in part without permission is prohibited.
Purchasing Managers' Index™ (PMI®) data are compiled by S&P Global for more than 40 economies worldwide. The monthly data are derived from surveys of senior executives at private sector companies, and are available only via subscription. The PMI dataset features a headline number, which indicates the overall health of an economy, and sub-indices, which provide insights into other key economic drivers such as GDP, inflation, exports, capacity utilization, employment and inventories. The PMI data are used by financial and corporate professionals to better understand where economies and markets are headed, and to uncover opportunities.
Read our latest PMI commentary here.
This article was published by S&P Global Market Intelligence and not by S&P Global Ratings, which is a separately managed division of S&P Global.
Theme
Location
Products & Offerings