16 Jun, 2026
US real estate deal value continues to grow in 12 months ended March 31

Aggregate US real estate property transaction value continued to increase in the first quarter, according to data from Real Capital Analytics.
For the last-12-month period (LTM) ended March 31, 2026, the data showed an increase compared with both full year 2025 and the year-ago period in aggregate transaction value across all four analyzed property types — apartment, industrial, office and retail.
Apartment
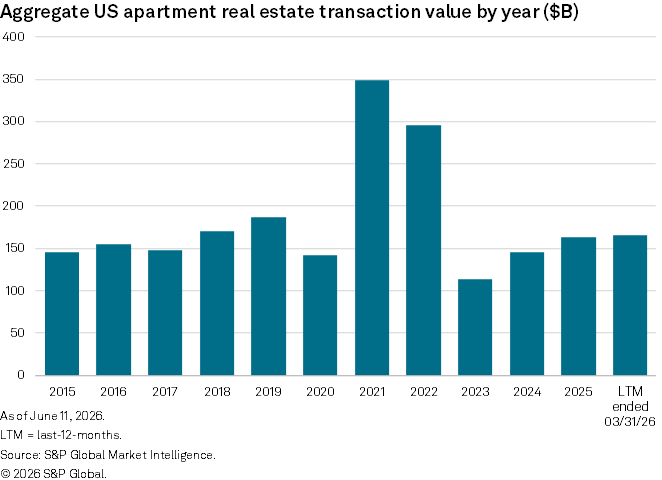
Aggregate apartment transaction value in the US grew to $165.71 billion for the LTM ended March 31, up 7.4% year over year and 1.5% compared with the entirety of 2025.
By property market, Dallas remained the top market by apartment transaction value over the analyzed 12-month period, with 206 recorded properties sold aggregating to $9.44 billion in transaction value, a 10.5% decrease year over year. The average cap rate for apartment transactions in the Dallas market was 5.3%.
The aggregate apartment transaction value grew 25.0% year over year to $7.54 billion for Atlanta, ranked second, and increased 38.6% to $6.07 billion for Houston, ranked third.
Chicago followed with 188 apartment properties sold for $6.00 billion in aggregate transaction value during the LTM ended March 31, up 62.7% year over year. Seattle rounded out the top five markets by apartment transaction value over the same period at $5.97 billion.

– For further analysis, try the Real Estate Property Transaction Excel template.
– Set email alerts for future Data Dispatch articles.
– Read some of the day's top news and insights from S&P Global Market Intelligence.

Industrial
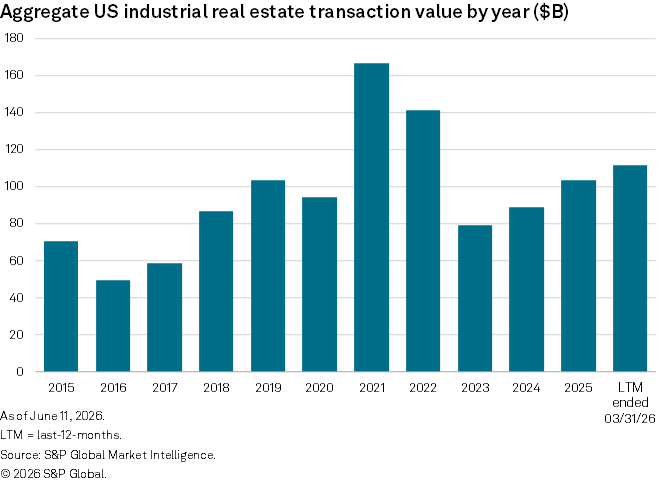
Aggregate industrial transaction value in the US increased 16.8% year over year in the LTM ended March 31 to $111.45 billion.
Two Texas markets, Dallas and Houston, topped the chart with the largest aggregate industrial transaction value. Dallas recorded 327 industrial property transactions over the analysis period, aggregating to $7.27 billion in transaction value, a 5.7% increase year over year. The industrial transaction value for Houston increased 26.2% year over year to $4.98 billion during the same period.
Atlanta rounded out the top three markets by industrial transaction value, with 249 properties sold for a total transaction value of $4.79 billion. The average cap rate for industrial transactions during the period was 5.5%.

Office
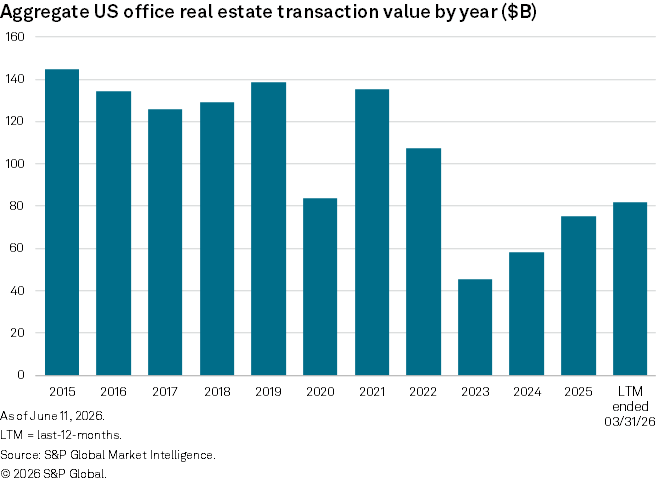
The office sector recorded the largest increase in transaction value across the four analyzed property types, at $81.79 billion for the LTM ended March 31, representing a 44.4% jump year over year and an 8.8% increase over the 2025 total.
Manhattan, New York, was the largest market by aggregate office transaction value, up 34.2% year over year to $11.85 billion. The 121 office property transactions during the 12-month period sold at an average cap rate of 6.3%.
The aggregate office transaction value of the San Francisco market grew 268.5% year over year to $5.32 billion, followed by the Dallas market, with year-over-year growth of 91.6% to $4.23 billion.
Office transaction value in Los Angeles, the fourth-largest market, dipped 1.6% year over year to $3.83 billion for the LTM ended March 31. Boston recorded a 23.2% decline year over year in aggregate office transaction value to $2.20 billion, ranking it as the eighth-largest market.

Retail
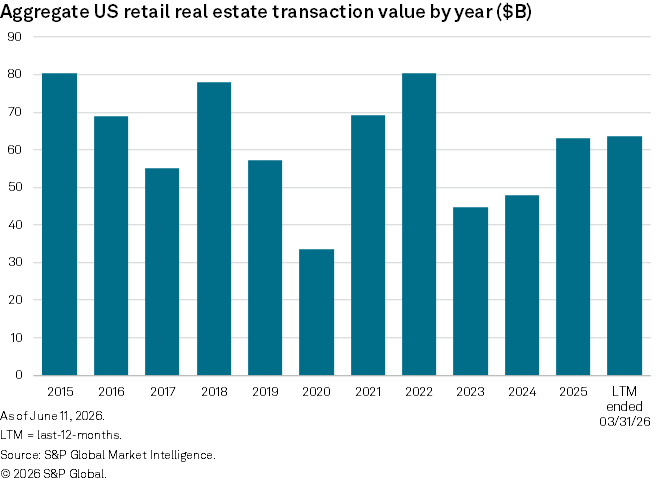
Retail property transaction value increased 29.8% year over year during the LTM ended March 31, to $63.65 billion, a 0.8% increase over the 2025 annual total.
Los Angeles remained the top market by aggregate retail transaction value, up 9.9% year over year to $3.39 billion. The average cap rate for retail property transactions during the period was 6.0%.
Houston and Dallas followed, both with an aggregate retail transaction value of $3.11 billion.
Manhattan and the New York City outer boroughs rounded out the top five markets for retail transaction value, at $2.58 billion and $2.48 billion, respectively.