


2 Aug, 2021
US leveraged loans post worst monthly return since March 2020

Concerns of rising coronavirus cases spurred by the delta variant created a widespread ripple effect across financial markets in July, including for floating-rate debt. On July 19 alone, the S&P/LSTA Leveraged Loan Index lost 0.11%, the biggest daily decline since November 2020. U.S. loans dipped 0.01% in the entire month of July, the worst performance since the pandemic-induced sell-off in March 2020. Term loans backing companies and industries most affected by the COVID-19 pandemic took a bigger hit, pushing some corners of the market deeper into the red.

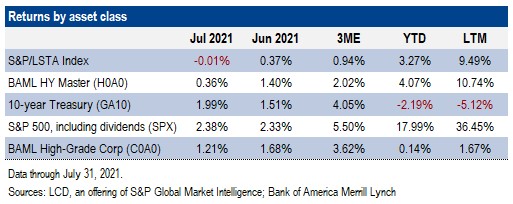
The negative 0.01% performance was only the second negative reading for the $1.26 trillion asset class in the last 16 months (loans lost 0.002% in March 2021). On average, loans have gained 76 bps per month over the last 12 months. Since the end of March 2020 the Index has rallied more than 22%, although the rally has decelerated in 2021. Through the first seven months of the year, U.S. loans are up 3.27%.
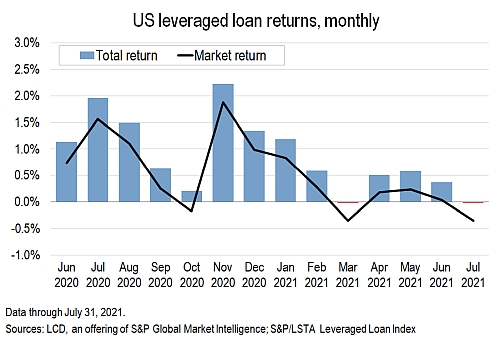
Declining secondary prices fueled July’s loss. The market value component of total return, which measures the change in secondary prices, fell 0.35% in July, the biggest setback in 16 months. This was the second negative reading this year and the third since March 2020.
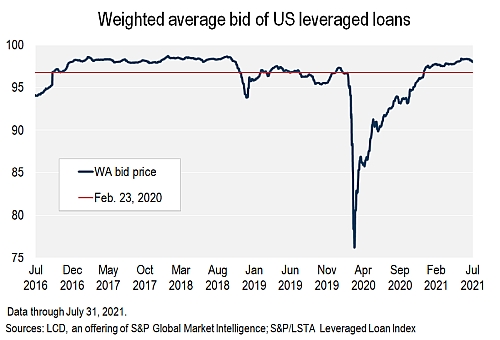
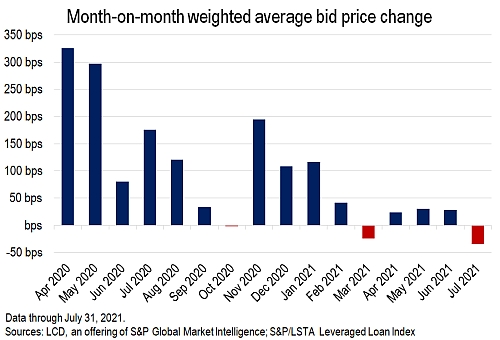
Indeed, the average bid of the Index has risen almost uninterruptedly since last April, reaching a pandemic-era high of 98.42 on June 12. Over the last 16 months the weighted average bid has declined just three times on a month-over-month basis, and the 34 bps retreat in July marks the biggest loss since March 2020. Nonetheless, at 98.04, the current reading is 49 bps above the end of the first quarter, and almost two points higher than the 2020 year-end reading (96.19).
The Leveraged Loan 100 Index, which captures the 100 biggest, most-liquid names in the loan market, lost 0.24% in July, based on total return, the third negative reading in the last 12 months. On average, these larger names have gained 0.55% per month over the last 12 months. The market value component of the LL100 lost 54 bps last month, the second consecutive period in the red.
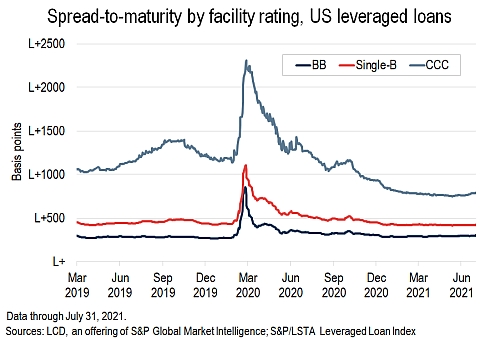
Gauging loan market performance by credit quality reveals a departure from recent trends. For the first time in 15 months, the CCC sub-index underperformed the higher rated BB and B sub-indices. Moreover, with a 0.26% loss in July, triple-Cs dipped into the red for the first time since a 22.2% decline during the pandemic-induced sell-off in March 2020. In the 15 months that followed that precipitous fall, the CCC sub-index gained 42.7%. Despite the latest setback, triple-C names are up 9.73% in the year to date, the strongest performance over the first seven months of the year since 2010.
The triple-C cohort of loans is much smaller than the higher-rated buckets, comprising 180 facilities, versus 279 for double-Bs and 847 for single Bs, and tends to be more volatile given the often-stressed status of its constituents. A drastic price change in one name could cause significant swings in overall returns. In fact, the five biggest names in the cohort together account for roughly 21% of the overall par amount outstanding tracked by this sub-index. For reference, within the broader S&P/LSTA Leveraged Loan Index, the top five names account for just 3.14%.
In addition to credit-specific issues driving the CCC returns, sector concentration played a role in July. Roughly 9% of CCC sub-index comes from the Leisure sector, including borrowers such as the cinema operator Cineworld Group PLC and Equinox Fitness Clubs. This is a much higher concentration than in the loan market overall, at 3.8%.
Of course, last month's pandemic-driven sell-off over rising case numbers from the delta variant had a bigger impact on the Leisure sector borrowers, putting this industry at the bottom of the pack. This was the first negative return for the sector in nine months, since the positive news around the Pfizer Inc. vaccine last November. Cumulatively, Leisure loans gained 13.4% between November 2020 and June 2021.
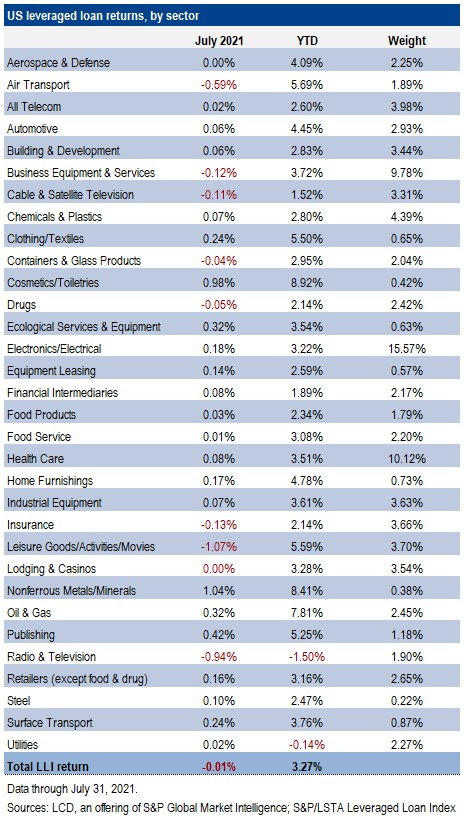
Similarly, the Air Transport industry, which includes American Airlines Group Inc. and United Airlines Holdings Inc., declined by 59 bps last month, the worst performance in 12 months and only the second time in the red over that period. Since the vaccine news last November, the sector has gained roughly 15%.
Shrinking yields
Despite the retreat in secondary prices, secondary market yields remain near record lows. At the end of July the average yield-to-maturity was 4.30%, as tracked by the Index, just a few basis points above the all-time low of 4.21% on June 11. A year ago, Index loans had an average yield of 6.11%, and they started off 2021 at 4.70%. At the same time, the average discounted spread to maturity, which takes into account the bid price and nominal spread on a credit, has hovered around L+400 for the last three months, down from L+443 at the start of the year and around L+530 a year ago.
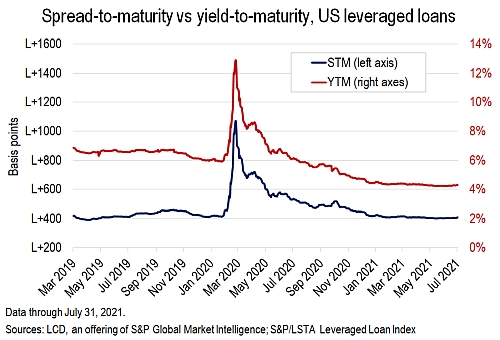
Declining yields across the board continue to fuel investor demand for lower-rated (and higher-yielding) paper. In fact, while the double-B discounted spread-to-maturity is currently above pre-pandemic levels, the single-B and triple-C cohorts are well inside it. At the end of 2019, double Bs stood at L+273; they are currently L+305. At the same time, the single-B sub-index is almost 17 bps tighter now than at the end of 2019 (L+423 vs L+440), while triple-Cs are more than four points tighter (L+789 vs L+1,233).
Technicals
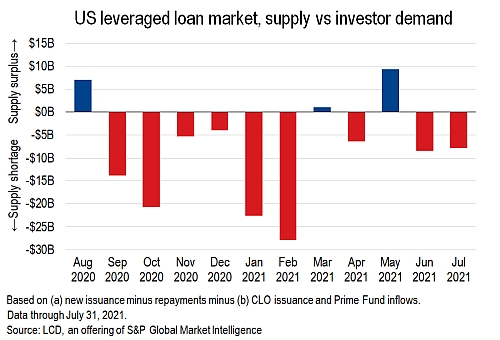
Market technical conditions continued to favor borrowers in July as the measurable demand for loans once again exceeded supply. LCD measures net loan supply as the change in outstandings, per the S&P/LSTA Index, or newly issued loans joining the index, minus loans being repaid. LCD defines investor demand as CLO issuance combined with cash inflows/outflows at retail investor loan funds.
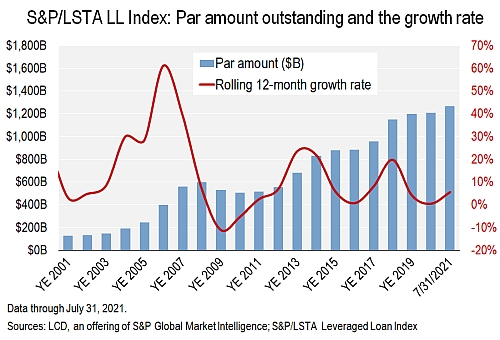
Starting with supply: The par amount outstanding tracked by the index expanded by another $3.3 billion in July, to $1.26 trillion, a new record. The index has grown for five consecutive months, totaling $75 billion, the biggest expansion for any comparable period since February 2019. This translates into a 6.3% growth rate since the end of February 2021. The loan market grew by just 0.5% in all of 2020.
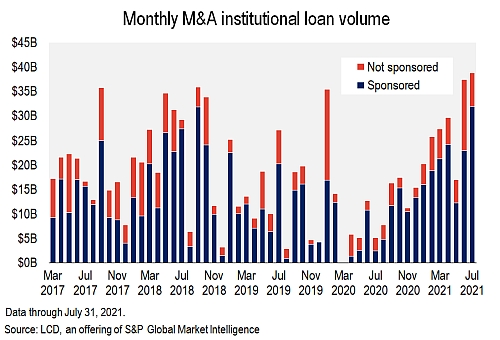
M&A-related issuance, which typically translates to net supply, set a new record in July, at $38.8 billion, eclipsing the prior record set just a month earlier ($37.5 billion). Some 82% of July activity funded borrowing by private-equity backed companies, totaling $31.9 billion, also a record high. Sponsored M&A-related issuance is running at the fastest pace since the Global Financial Crisis, with $147.6 billion issued through July 31, accounting for 75% of the total M&A volume (which is also at record pace this year).
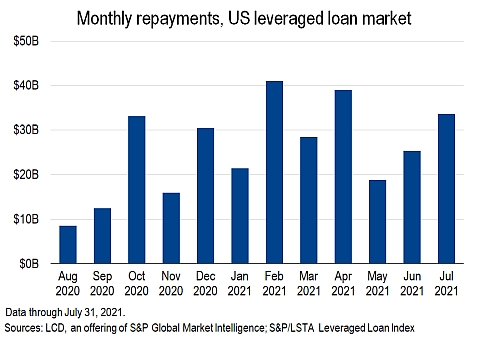
While issuance increased in July, so did repayments, taking a big bite out of the total par amount outstanding. Roughly $33.6 billion of loans were paid down last month, a three-month high, up from $25.3 billion in June and a $25.7 billion 12-month average.
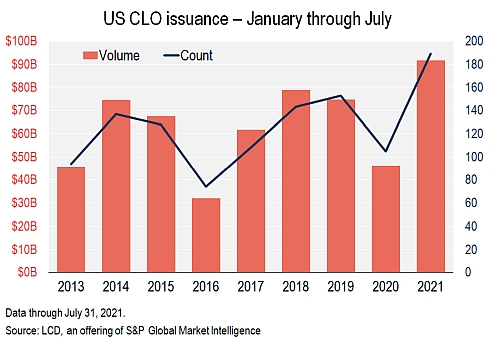
Turning to demand: Again, LCD defines investor demand as CLO issuance combined with cash flows to U.S. loan funds. The U.S. CLO market was quiet in July, by current market standards, though it remains on track to smash the full-year record. With $9.3 billion of vehicles priced, July was the second-slowest month this year, well short of the $13.7 billion average in the first half of 2021. However, it followed two record-setting quarters, lifting year-to-date issuance to $91.7 billion.
At the same time, retail loan investors continue to flock to the floating-rated asset class, although the pace has slowed. There have been net inflows in 28 of the 30 weeks through July 28, totaling $21.6 billion, based on Lipper's weekly reporters. The $67.1 million outflow for the week ended July 21 broke a streak of 27 straight weekly gains for the asset class. For the four weeks through July 28, the inflow tally was $1.3 billion, the lowest reading this year, down from $3.2 billion in June and $3.7 billion in May.

More broadly, LCD estimates $1.8 billion of inflows into retail loan funds in July, an eighth consecutive monthly inflow. The sum of these retail loan fund investments and CLO issuance ($9.3 billion) is $11.1 billion, the lowest measure of investor demand this year. In the first half of the year, investor demand averaged $18.4 billion per month.
Combining the $3.3 billion increase in outstandings — the proxy for supply — with $11.1 billion of measurable demand leaves the market with a $7.8 billion supply shortage, down from $8.4 billion in June. For 2021 overall, measurable demand has exceeded supply by $63 billion, a sharp increase from the $22.6 billion at this point in 2020.
Other asset classes
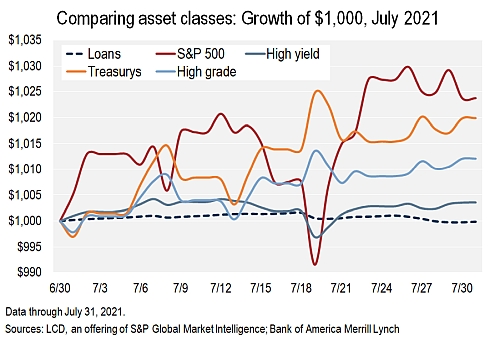
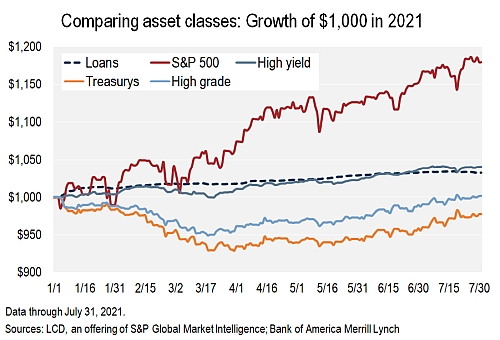
In July, leveraged loans ended up at the bottom of the pack for the second month in a row, based on all the asset classes LCD tracks for this analysis. However, aside from equities and 10-year Treasurys, all other asset classes posted weaker returns in July than in June. For the year-to-date, loans have underperformed equities and high-yield bonds, but have outperformed high-grade bonds and 10-year Treasurys.
Biggest movers
Loan issuers in industries most affected by COVID-19 were among the top decliners in July as concerns over the surging delta variant impacted names recovering most in the re-opening trade. Movie theater operators Cineworld and AMC Entertainment Holdings Inc. were both among the top five declining issuers last month. AMC's first-lien term loan due April 2026 (L+300, 0% Libor floor) dropped all the way to 88.5/89.5 by month-end, from around 93.75/94.75 at the start of July, while Cineworld's largest term loan B due February 2025 (L+250, 0% Libor floor) fell to 80.5/82 by month-end, from 87.875/88.875 at the beginning of the month. Also taking a hit in July were airlines, with both American Airlines and United Airlines among the top 10 decliners.
Among the top advancers last month were lower-rated loans, despite the triple-C rated portion of the index generally underperforming its higher-rated counterparts. Term loans for Exela Technologies
