Featured Topics
Featured Products
Events
S&P Global Offerings
Featured Topics
Featured Products
Events
S&P Global Offerings
Featured Topics
Featured Products
Events
S&P Global Offerings
Featured Topics
Featured Products
Events
Financial and Market intelligence
Fundamental & Alternative Datasets
Government & Defense
Banking & Capital Markets
Economy & Finance
Energy Transition & Sustainability
Technology & Innovation
Podcasts & Newsletters
Financial and Market intelligence
Fundamental & Alternative Datasets
Government & Defense
Banking & Capital Markets
Economy & Finance
Energy Transition & Sustainability
Technology & Innovation
Podcasts & Newsletters
4 Nov, 2021
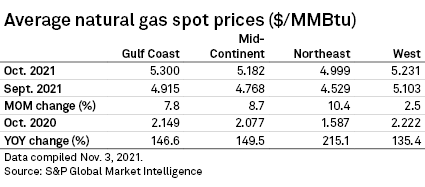
The average price of natural gas for day-ahead delivery in October continued to record triple-digit growth year over year in all the regions of the U.S., with the Northeast region posting the highest yearly increase of more than 200% to a spot gas price index of $4.999/MMBtu.
The Mid-Continent region saw the next highest yearly gain of nearly 150% to a spot gas price index of $5.182/MMBtu, followed by the Gulf Coast region, which reported a year-over-year boost of about 147% to a spot gas price index of $5.300/MMBtu. Compared to the same period in the previous year, the West region's spot gas price index climbed 135% to $5.231/MMBtu.

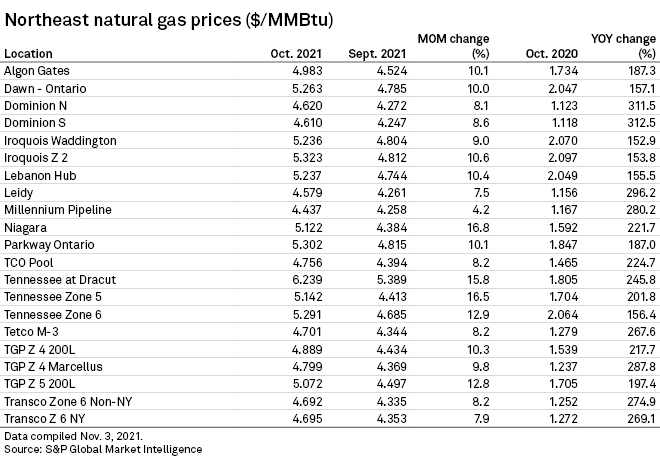
Gas hubs in the Northeast region posted year-over-year gains ranging from nearly 153% to as high as almost 313% in October. Many of the gas hubs in the region recorded spot gas price indexes above the $5/MMBtu mark, and the Tennessee at Dracut gas hub, which saw a 245.8% yearly boost, reported the highest spot gas price index at $6.239/MMBtu.
The ongoing uptrend in natural gas prices is being driven by factors such as increasing demand amid the country's recovery from the pandemic and a global supply crunch. Consumers and sector experts have also previously expressed concerns that a cold snap this winter could cause contract prices to exceed the $10/MMBtu level.

In terms of production, the U.S. Energy Information Administration in its monthly Drilling Productivity Report released Oct. 18 forecast all the shale gas producing regions in the country to report month-over-month boosts, except for the Anadarko region, which is expected to post a decline to about 6.07 Bcf/d in November from 6.11 Bcf/d in October.
The EIA anticipates the Haynesville region to see the largest monthly increase from 13.51 Bcf/d in October to 13.65 Bcf/d in November. Appalachia, the biggest shale gas producing region in the U.S., is expected to see production grow from 34.84 Bcf/d in October to 34.88 Bcf/d in November. Total shale gas production is projected to climb from 87.67 Bcf/d in October to 87.92 Bcf/d in November, the EIA said.
Market prices and included industry data are current as of the time of publication and are subject to change. For more detailed market data, including power and natural gas index prices, as well as forwards and futures, visit our Commodities pages.