Featured Topics
Featured Products
Events
S&P Global Offerings
Featured Topics
Featured Products
Events
S&P Global Offerings
Featured Topics
Featured Products
Events
S&P Global Offerings
Featured Topics
Featured Products
Events
Financial and Market intelligence
Fundamental & Alternative Datasets
Government & Defense
Professional Services
Banking & Capital Markets
Economy & Finance
Energy Transition & Sustainability
Technology & Innovation
Podcasts & Newsletters
Financial and Market intelligence
Fundamental & Alternative Datasets
Government & Defense
Professional Services
Banking & Capital Markets
Economy & Finance
Energy Transition & Sustainability
Technology & Innovation
Podcasts & Newsletters
BLOG — Aug 17, 2020

By Alice Gladen
Using our range of data assets to assess how the chemicals industry has responded to COVID-19 and other major events.
The value of trade in organic chemicals reached $846 billion in 2019 however, this was down by around 10% from 2018 values. 2019 was a tumultuous year with issues such as the Chinese economic slow down & US - China trade wars having a big impact on global trade. China, US & Germany remain the top three chemical giants in industry, each dominating import and export activity within their respective regions with China holding 12% of the market share, US holding 11% and Germany holding 8%.
COVID-19 has obviously had a huge impact on global trade across many industries. On a global basis this is set to be the most influential event since World War Two. World real GDP is projected to fall by 6.0% in 2020 - the biggest decrease since the 1940's. The world is seeing weak global demand, disruptions to supply chains, reduced consumer spending & reduced tourism all contributing to the substantial decreases in both trade and GDP. The record low oil prices in 2020 have no doubt impacted the chemicals and petrochemicals industry. Low demand for fuels due to lockdowns has led to lows in production of many chemicals that are often only formed by coproduction processes. Overall trade in organic chemicals is down almost 10% on average year-to-date compared to 2019 (Figure 1).
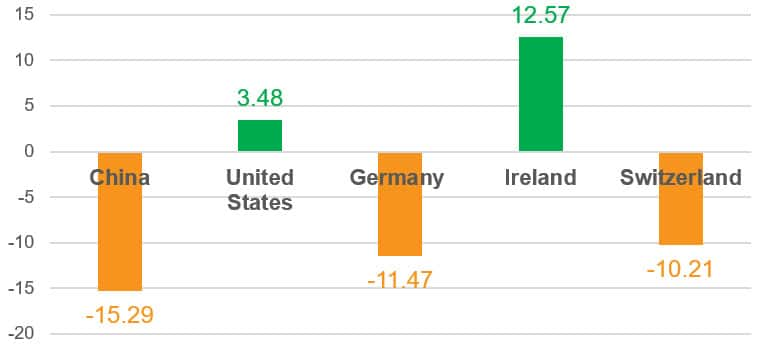
Figure 1: Year-To-Date (Jan to May) total trade in organic chemicals for 2020 v 2019 Source: IHS Markit Global Trade Atlas
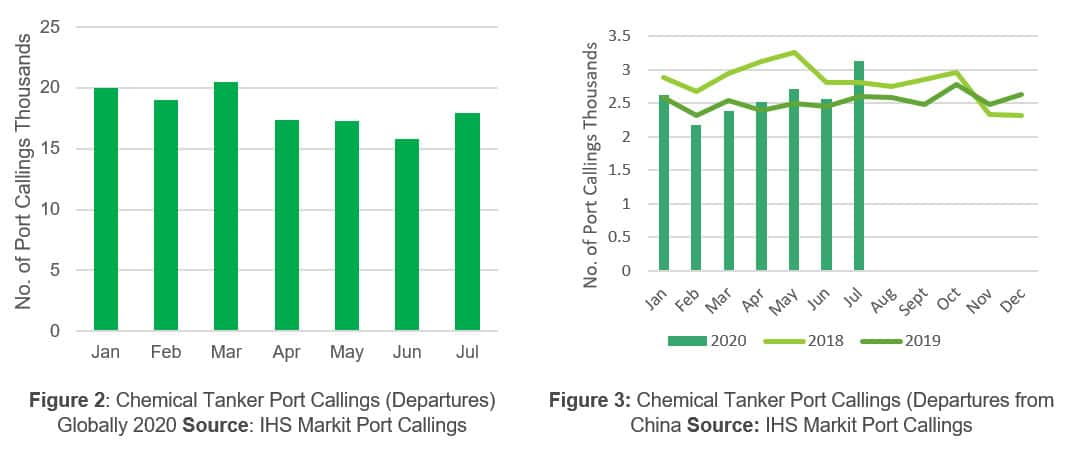
Using our AIS tracking and comprehensive ports data we can identify port callings on a global basis. We can limit this to vessel types such as chemical tankers to gain insight into the sort of volumes being transported globally. Looking at the global port callings of chemical tankers we can see a drop-off in activity from April through to June with a slight increase in July - this correlates with much of what we expect based on lockdown activities (Figure 2). Looking at China we see a drop of 6% in February when the country was under lockdown. We then see a recovery throughout march to July (Figure 3). This again correlates with reductions in lockdown and a return to normality in trade and demand.
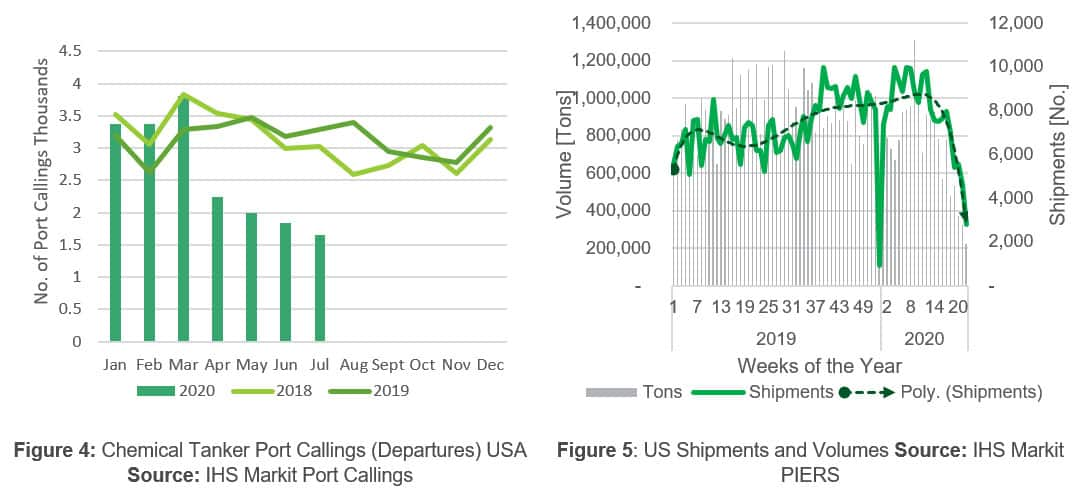
Looking at the US we see a far more drastic picture. April saw a drop of 33% compared to 2019 levels and it only gets worse through to July which saw a 50% deduction in tankers (Figure 4). We can use our trade data to look at the number of shipments arriving at the US and the subsequent volumes coming in (Figure 5). 2020 so far has been somewhat of a rollercoaster with massive highs in 2020, to the stupendous lows following week 14 (End of March) where volumes and shipments started to decline following lockdowns. We can also calculate shipping efficiency - that means looking at the tons per shipment compared to the average. The shipping efficiency is getting higher as 2020 progresses. It's unsurprising that with volumes and shipments decreasing, there appears to be an increasing focus on shipping more efficiently to minimise costs leading to greater volumes per shipment, although these shipments only represent a fraction of what 'normal' would look like.
Deep Dive into Individual Chemicals
Ethylene
Ethylene is one of the largest-volume petrochemicals worldwide. Additionally, because of its size and broad usage, ethylene is often used as a benchmark for the performance of the petrochemical industry. Ethylene demand is driven primarily by growth of polyethylene-based consumables; bottles, and packaging demand; and increasing requirements for PVC used in construction and pipe applications. Trade of the refrigerated liquid form often makes long distance shipments cost prohibitive. As such most ethylene is either transported via direct pipelines or used in regional trade.
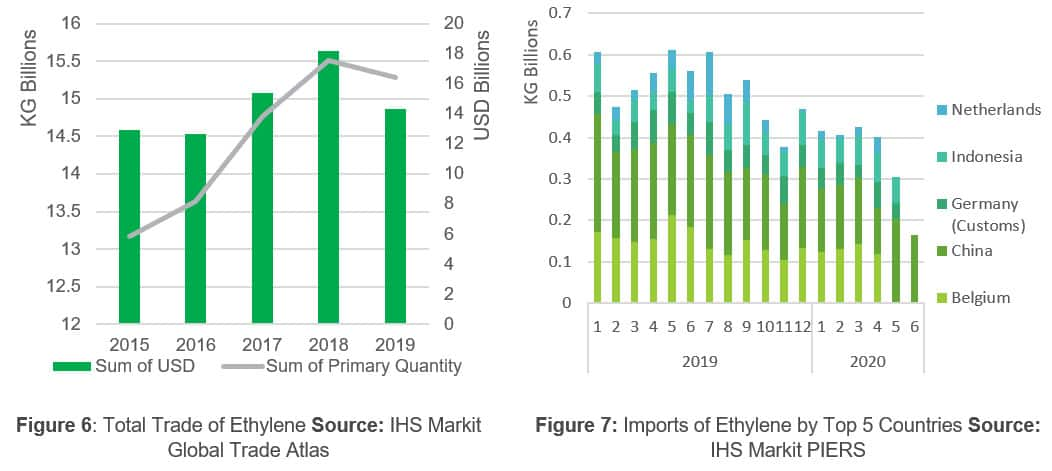
Looking at total trade of ethylene - trade was growing until 2019 when both volume and value were low (Figure 6). Volume dropped by 21% in 2019 - potentially due to extensive tensions between the US and China and the China slowdown. Trade was therefore on the decline before COVID-19 hit. Looking at the imports in 2020, this seems to have only gotten worse. For the top five importing countries there is a decrease throughout all of 2020 (Figure 7). For China trade was low until a slight bounce back in May and June as normal demand and production increased. This is good news for those who rely on China as an end purchaser as their recovery seems to be on track.
As we saw, China is a key importer of ethylene and the trade line between the US and Asia is a key one. Looking at the US exports of ethylene over the last few years we can see the impact the trade war had in 2019 (Figure 8). The exports to China dropped massively in 2019 compared to previously. For China this represents only a small amount of their total imports whereas for the US this represents a significant change. We also see the rise in US exports to Europe in 2019 such as to Belgium and can imagine this is going to have more of an influence over next few years. Those suppliers who previously supplied China may want to look towards trade routes with Europe to counteract this.
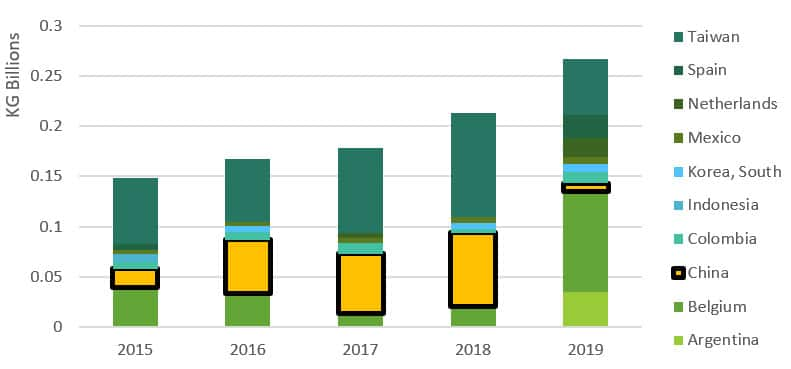
Figure 8: US exports of ethylene to top ten countries Source:IHS Markit Global Trade Atlas
Propylene
Propylene is the second-largest volume chemical produced globally. Propylene consumption has been increasingly linked to emerging countries (China, more particularly), where the improvement in living standards and a growing urbanization are driving an increasing usage of a broad spectrum of polymers and chemicals. Global propylene trade is dominated by Northeast Asia. In 2019, the region accounted for about 52% of global exports and 61% of global imports. China is estimated to cover about 87% of regional propylene imports.
Trade throughout 2019 was fairly steady and trade remained stable. 2020 started with the propylene market in severe oversupply. Lackluster demand prompted inventories to reach record highs. However, trade in 2020 has dropped significantly. Looking at China's imports of propylene which are reliant on South korea and Japan, the levels dropped by almost 50% in January through to March before a slow recovery happened throughout Q2 (Figure 9). The COVID-19 pandemic hit gasoline demand particularly hard as lockdowns reduced vehicle miles driven, refiners responded by throttling back refinery runs and Fluid Catalytic Crackers operating rates. As a result total propylene production fell by 1.2 billion pounds in the first half of 2020 versus the same period a year earlier.
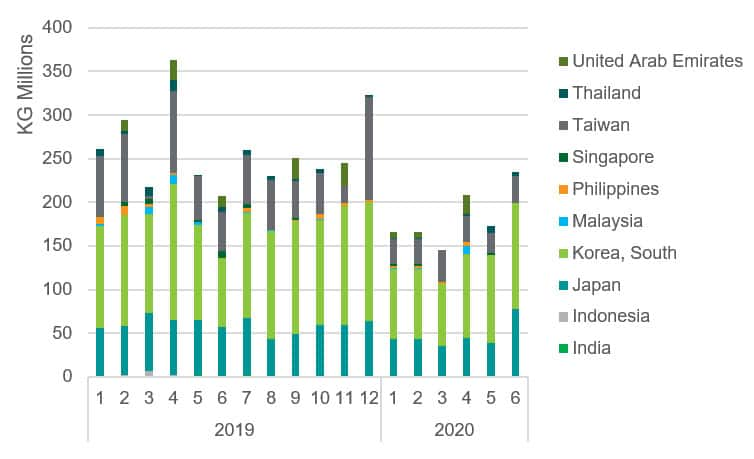
Figure 9: China imports of propylene Source:IHS Markit Global Trade Atlas
One further uncertain factor for the propylene industry is new environmental regulation in the shipping industry. The International Maritime Organization (IMO) agreed in October 2016 to reduce sulfur in marine bunker fuel from 3.5% to 0.5% as of January 2020. This event is likely to be hugely disruptive and uncertain, because of:
Bunker fuel today is primarily high sulphur fuel oil (HSFO), which has been a welcome disposal route for otherwise uneconomic high sulphur crude oil residues. Options to replace it are scrubbers (Which are fitted to the vessel and remove sulfur from HSFO, very low sulphur fuel oil (VLSFO), or marine gasoil (MGO). This is expected to tighten global gasoil supply, which then throws up challenges of availability. From a propylene perspective, the impact is within the refinery-based propylene production, namely fluidized catalytic cracking (FCC) units and cokers, as gas oil, the feedstock for FCCs, is desirable as a blendstock for low-sulfur bunker fuel.
Co-production of propylene from refining sources such as FCC and cokers represents a significant supply of propylene into the chemicals market at 32 million metric tons per year. Thus, a reduction in FCC feedstock translates to a direct reduction in refinery-based propylene. The FCC feedstock is expected to decrease by 2% v 2019 which will directly impact the propylene yields. Ultimately, the impact to the propylene market may wane as a significant amount of the global vessel fleet is outfitted with scrubbers that allow compliance with the IMO rules without requiring low-sulfur bunker fuel. Such implementation is expected to occur by 2025. However, the level of scrubber uptake has been low (around 3,500 confirmed vessels), and many future fittings have been cancelled or delayed due to COVID and with the low oil prices seen recently the financial investment is not deemed worthy.
Ethylene Dichloride (EDC)
The EDC that is produced from chlorine and ethylene has many uses and goes on to produce essential PVC goods such as piping, furniture and other goods. Total trade of EDC increased in value throughout the last five years with volume also increasing until 2017 (Figure 11). With globalization, we see markets developing and expanding in different regions each of which having different production capacities and different price points, making competition quite fierce. Asia is the most active market for this commodity, importing 73% of the total market size for production. The Americas in comparison typically sees high exports, and very low imports until recently, when Brazil started to import from the US.
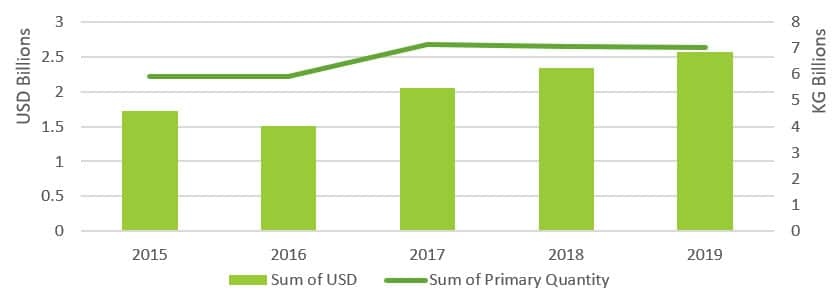
Figure 11: Total trade of EDC Source: IHS Markit Global Trade Atlas
In May 2019, the Brazil Geological Survey published a report linking Braskem's salt mining operations to the geological damages that were observed in nearby communities; including slumping, tremors and fissures as a result of the intensive mining that is fuelling their nearby plant in Maceio Alagos. The plant itself has two capacities, the first of which is is chlor-alkali, the second of which is EDC. Looking at capacity to produce, In 2018 the Maceio plant both through direct chlorination and oxychlorination, represented 47% of Brazil's total production capacity, and Brazkem in general represents ~60% of total production capacity in Brazil. Therefore, the closure of this mine caused a big drop in the production of EDC in Brazil. The bar chart here shows the top ten countries imports of EDC (Figure 12). Brazil has a very low and sporadic history of importation - The few import shipments likely taking place to support production during times of high demands, and exploitation of favourable trade tariffs at the time. Following the announcements in May 2019, Brazils imports started to gradually rise month-on-month, having a considerable impact in world demand of EDC. This stream of imports are likely to support production due to the closure of the nearby salt mine, an essential source of chlor alkali. Without salt to create the brine needed, this either leaves several options for Braskem to explore, including already made EDC or potentially the large scale shipments of salt.
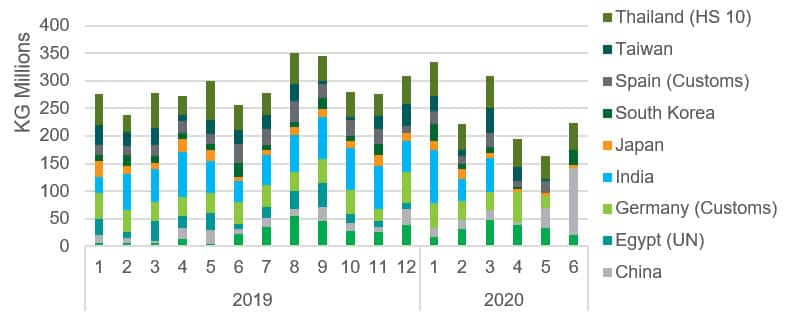
Figure 12: Top ten countries imports of EDC Source:IHS Markit Global Trade Atlas
Brazil recently announced a project to increase access to potable water to 99% of the population by 2034. Currently only around 80% of the population have access to potable water and sanitation lags behind that of many countries. This project will take many years. To reach this goal will require a significant increase in both chlorine production for water treatment and also a substantive increase to the PVC pipe network with ongoing maintenance of this. We expect a combination of increased domestic demand for PVC resin and an increase in EDC imports to support part of the increase in PVC demand. This is hugely important given the shutdown of Braskems chlor-alkali plant meaning even further need for chlorine and PVC imports. Brazils main trade partner for PVC is Colombia, followed by Asian material, US is last (because there is an antidumping duty). For EDC, their main trade partner is the US, but there could be possibility of Middle East suppliers. This new project in Brazil may represent a significant opportunity to some of these exporters.
Forecasting the Industry
So finally - how do we view the chemicals industry in the long-term? Our recent trade forecast was updated to include the impact of COVID-19 and the current year events on trade. We can see that for organic chemicals trade there is expected to be a 10% dip in trade volume and value. However, this quickly recovers in 2021 and then slow recovery and normal growth throughout 2022-2025. This gives us a good indication of how the long-term will look but only time will tell if recovery occurs this quickly or if subsequent second waves may have an impact on trade and the industry even further. For petrochemicals and the chemicals industry - an industry which is so intrinsically linked to consumer demand and activity the situation is complex and requires ongoing monitoring.
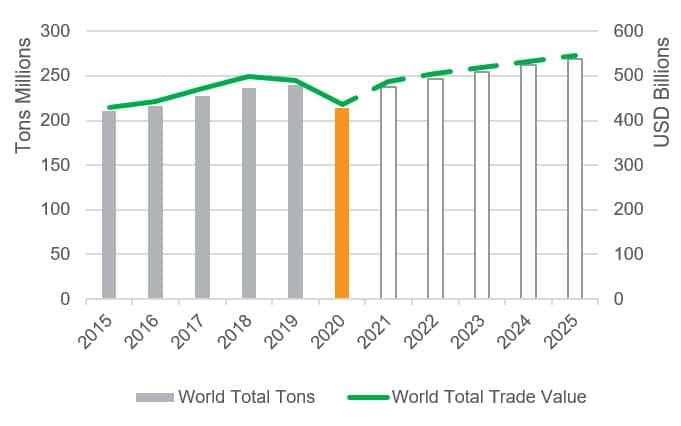
Figure 13: Forecast of organic chemicals Source:IHS Markit GTA Forecasting
Subscribe to our monthly newsletter and stay up-to-date with our latest analytics
Posted 17 August 2020 by Alice Gladen, Consultant, Chemical Consulting, S&P Global Commodity Insights
How can our products help you?