


BLOG — Jul 01, 2021
Recovery in global trade becomes broader and more sustainable (Global Trade Monitor – June 2021)

Main Observations
- Recovery in the global trade in commodities is ongoing and becoming more sustained and broader; market optimism dominates by now among the top ten economies
- According to official trade statistics published in IHS Markit Global Trade Atlas (GTA), the market-leading bilateral trade research tool, In Q1, exports grew in all the top ten states year-on-year with the fastest growth in (+48.6%) followed by Brazil (+15.6%), South Korea (+12.5%), and Canada (+11.6%)
- Imports, in turn, grew in Q1 for all the states apart from the UK, and year-on-year (yoy) increases were the highest in China (+27.6%) followed by Russia (+17.9%), South Korea (+12.1%), and United States (+11.7%) as reported in Global Trade Atlas (GTA).
- It seems overall that the COVID-19 crises impacted the consumer confidence in the top ten group (and demand side of the economy) to a more considerable extent than the production for exports (supply-side considerations)
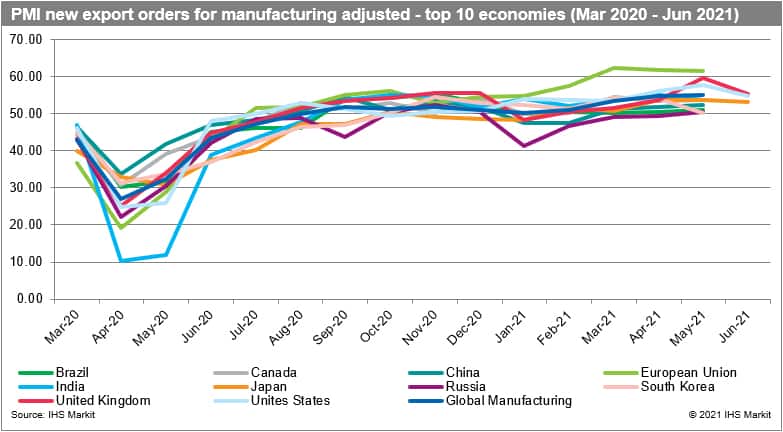
- The adjusted PMI NExO readouts for the global manufacturing industry in May 2021 were above the benchmark value of 50.0 points (54.91) a nine-month in a row and at the highest level in 2021. It is pointing to a recovery in all top ten economies for the first time this year with the highest values for the EU (61.42), the UK (59.65) and the United States (57.85)
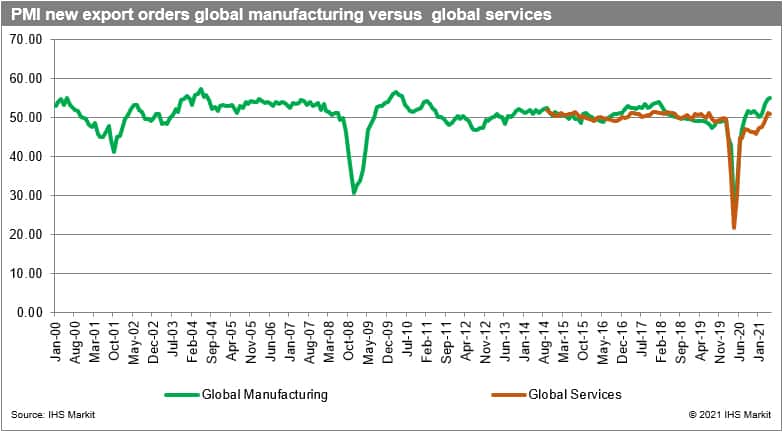
- Both PMI NExO for global manufacturing and global services (51.04) are by now above the 50.0 points benchmark the second month in a row, making the recovery of the global economy more sustainable
- We foresee a global recovery in 2021, with year-on-year real GDP growth rates predicted to reach 6.0%. The growth rates are predicted to vary between 5.7% (4.2% in 2022) for advanced, 6.5% (5.2%) for emerging, and 5.2% (4.9%) for developing states
Changes in Trade of the Top Ten Economies
- Global trade in commodities continued to perk up in the Q1 2021 from its collapse in 2020 due to the COVID-19 pandemic; with the pace of recovery diverging strongly across countries and regions of the world, with the recovery the fastest in China and East Asia in general
- By now, Global Trade Atlas (GTA) has reported data on exports of all top 10 states for Q1 2021 apart from India; exports grew yoy the fastest in China (+48.6%), followed by Brazil (+15.6%), South Korea (+12.5%), and Canada (+11.6%); it was below of 10.0% in the remaining states with the lowest growth in Russia (+0.2%)
- In March 2021, exports were growing yoy in all the states, with the recovery varying from 14.1% in the U.S. to 33.6% in the UK; in April, the yoy growth rates were significantly higher, ranging from +31.8% in China to 52.8% in the U.S. and +67.9% in Canada; this can be explained by a low base effect (the peak of decline in April - May 2020)
- Only three countries reported data for May 2021; the exports reported are growing in all of them +53.8% in Brazil, +45.6% in South Korea +27.6% in China
- Chinese exports grew for the twelfth month in a row. It is the seventh month in a row for South Korea and the fifth one in a row for Brazil and Japan, which indicates that the recovery, particularly in East Asia, is broad and is leading the global recovery
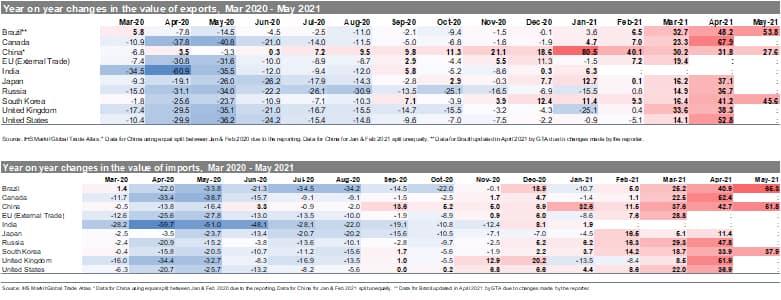
- By now, Global Trade Atlas (GTA) has data on imports of all top ten states for Q1 2021 once again apart from India; imports grew yoy the fastest in China (+27.6%) followed by Russia (+17.9%), South Korea (+12.1%), and United States (+11.7%); it was below of 10.0% in the remaining states with an actual decline in the United Kingdom (-4.4%)
- In March 2021, imports were growing yoy in all the states, with the recovery varying from 5.1% in Japan to 37.6% in China; in April, the yoy growth rates were significantly higher, going from +11.4% in Japan to +52.4% in Canada
- Only three countries reported data for May 2021; the imports are growing yoy in all of them +65.3% Brazil, 37.9% in South Korea, and +51.8% in China; the reported growth rates are at this stage higher than in the case of exports
- Chinese imports grew for the ninth month in a row, followed by the U.S. (Seventh month in a row) and sixth month in a row for South Korea; it seems that the COVID-19 crises impacted the consumer confidence (and demand-side) to a more considerable extent than the production side (supply)
Prospects for the Forthcoming Months
- The overall impact of COVID-19 on global trade and the global economy will depend on the duration, severity, and spatial distribution of the pandemic and associated severity of containment efforts taken by individual states.
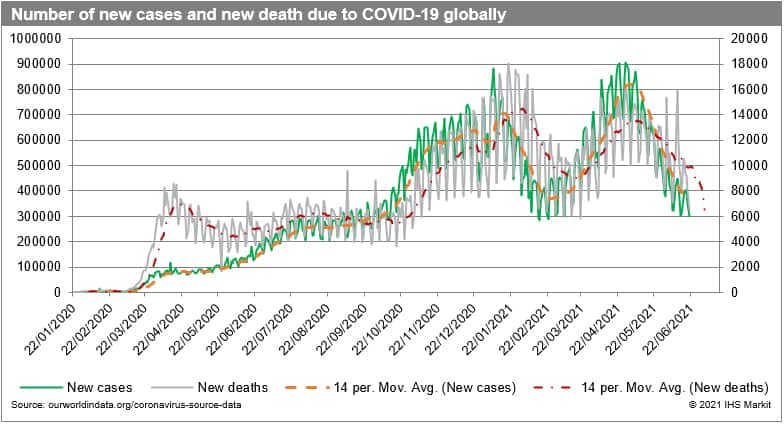
- The cumulative number of confirmed cases of COVID-19 globally by 19 June 2021 reached 178.2 million and 3.86 million deaths. The cumulative number of cases is the largest in Asia (54.4 million), Europe (47.7 million), North America (39.4 million), and South America (31.5 million); looking from the individual country perspective, the cumulative number of cases is the highest in the U.S. (33.5 million), India (29.9 million), Brazil (17.9 million)
- In June 2021, COVID-19 was spreading the fastest in India (1.76 million new cases), Brazil (1.38 million cases), Columbia (0.583 million), Argentina (0.487 million), and the USA (0.274 million cases). The top ten countries affected included as well Russia, Iran, Indonesia, South Africa and United Kingdom; the highest death toll in June 2021, in turn, was observed in India, Brazil, Columbia, Argentina & Columbia
- The 2-week moving averages of global new cases and deaths started to decline in May; however, the COVID-19 pandemic is ongoing
- The reported number of vaccinations globally reached 2.79 billion with 798 million people fully vaccinated, which is equivalent to 10.2% of the global population (far from the worldwide herd immunity threshold); the process of vaccination is picking up the pace; however, inequalities abound, only six countries or territories report by now the vaccination rate with two doses above of 60% - Gibraltar (99.0%) and Seychelles (68.6%); on a positive note, G7 announced in mid-June pledges of 870 Million COVID-19 vaccine doses, of which at least half to be delivered by the end of 2021 to least developed states
- The adjusted PMI new exports orders (PMI NExO) readouts for the global manufacturing industry in May 2021 were above the benchmark value of 50.0 points (54.91) a nine-month in a row and the highest in 2021. It was pointing to a recovery in all top ten economies for the first time this year with the highest values for the European Union (61.42), the United Kingdom (59.65) and the United States (57.85)
- Both PMI NExO for global manufacturing (54.91) and global services (51.04) are by now above the 50.0 points benchmark the second month in a row, making the recovery of the global economy more sustainable
- The most recent real GDP growth forecasts from IHS Markit were published on 17 June 2021 and are based on the baseline scenario of the impact of COVID-19 on the global economy
- The estimated contraction in real global GDP is 3.5% in 2020, varying between -4.6% for advanced, -1.6% for emerging, and -5.9% for the most affected developing economies
- We foresee a global recovery in 2021, with year-on-year real GDP growth rates predicted to reach 6.0%. The growth rates are predicted to vary between 5.7% (4.2% in 2022) for advanced, 6.5% (5.2%) for emerging, and 5.2% (4.9%) for developing states
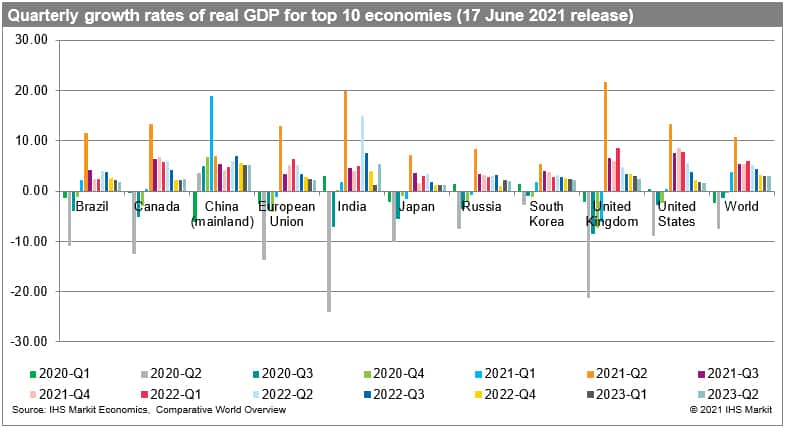
- Real global GDP contracted in every single quarter of 2020, with Q2 being the worst quarter. The estimated growth rate in Q1 2021 was 3.8% and varied between -0.3% for advanced and 10.1% for emerging economies. In Q2 real global GDP is forecasted to grow by 10.8%, with the growth impulse stronger for advanced (12.5%) than emerging economies (8.3%). The prospects for Q3 and Q4 are positive, with growth rates moderating to 5.3% and 5.4%, with recovery stronger again in advanced economies
- Recovery in China started in Q2 of 2020 following the COVID-19 related contraction in the first quarter. Apart from China (+18.9%), five other economies out of the top ten group are now estimated to have grown in real terms in Q1 2021. These are Brazil (+2.3%), Canada (+0.3%), South Korea (+1.9%), India (+1.7%) and the U.S. (+0.4%)
- All top ten are estimated to grow in Q2 and remaining quarters of 2021-22, with the strongest growth impulse in the UK, India, the UK, Canada, the EU and Brazil
This column is based on data from IHS Markit Maritime & Trade Global Trade Atlas (GTA) & GTA Forecasting.
The full version of this article is available on the Connect platform for IHS Markit clients with a subscription to GTA/GTA Forecasting or GTA Suite
Subscribe to our monthly newsletter and stay up-to-date with our latest analytics
*Please note that China (mainland) reported an aggregated value of trade for January-February 2020 and 2021 - for the year 2020 the data in the GTA database were equally split between the two months, while for 2021 the data were split unequally.
Please note that Brazil has revised data for 2020 affecting the reported growth rates (please be careful not to compare the current GTM Report with prior editions due to significant changes)