


BLOG — Nov 01, 2021
Monthly Global Trade Monitor – October 2021

A sustained recovery in global trade with more moderate prospects for global trade in Q4 and Q1 2022 with some unresolved challenges.
This analytics article utilizes trade data published by IHS Markit Global Trade Atlas (GTA) delivered via the new integrated trade data tool Global Trade Analytics Suite (GTAS).
Key Observations
- Global trade has overall recovered from the COVID-19 crisis with the peak of recovery in Q2 2021, and most of the sectors
- Growth rates in trade are becoming more moderated, gradually returning to more business-as-usual levels; still, many disruptions persist in some key Global Value Chains (GVCs) and can only ease off in 2022 with lower expected overall economy and global demand growth rates
- The adjusted PMI NExO readouts for the global manufacturing industry in September 2021 point to further growth in the short-run (51.02) and are above the 50.0 benchmark the 13th month in a row proving the sustained nature of recovery; however, they were falling over the last quarter to stabilize in September; at the same time the readouts for global services are below the benchmark pointing to stagnation for the 2nd month in a row
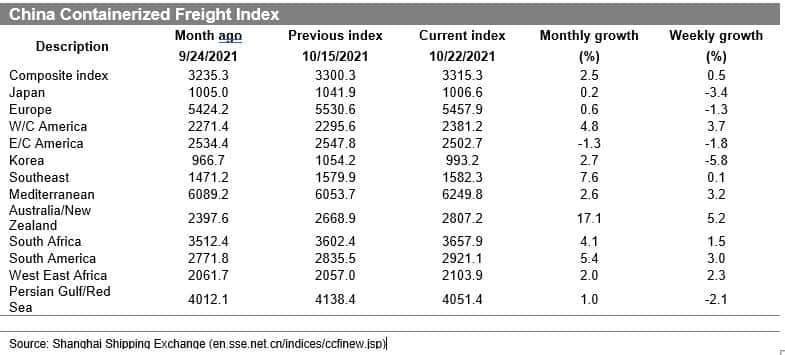
- Transport costs are still at very high levels, adversely affecting global trade flows. It is due to 6-7-year highs in crude oil and natural gas prices, excessive port congestion in many parts of the world, and due to COVID-19 related measures taken by some of the states; the composite index of the costs of freight by the Shanghai Shipping Exchange exceeded 3300 points (USD/TEU) in October
- The global recovery in 2021 is clear, with year-on-year real GDP growth rates now predicted to reach 5.5%. The growth rates are expected to vary between 4.9% (3.8% in 2022) for advanced, 6.5% (5.0%) for emerging, and 4.3% (5.0%) for developing states
- Real GDP growth rates in Q3 & Q4 are forecasted to be positive but much more moderated (varying from 2.4 - 7.3% in Q3 and 1.0 - 5.5% in Q4); we are clearly over the top of recovery from the initial COVID-19 crisis in reported real GDP growth rates, similarly to data on trade
Changes in Trade of the Top 10 Economies
- The data on growth rates point to a sustained recovery in trade (both exports and imports) among the top 10 economies for some of the states already in Q4 2020, most of the states in Q1, and all the states under analysis in Q2 2021 and Q3 for all the states that reported the data (growth rates in Q3 are on average lower than in Q2)
- Exports are growing in all the top 10 states from March 2021 onwards, with the situation in the first two months of 2021 more nuanced; imports, in turn, started growing in all the states a month earlier (Feb 2021) apart from the UK, which showed negative growth rates both in January and February
- Generally speaking, the growth ratesreported by the top 10 in 2021 are the highest in the months most adversely affected by the outbreak of the pandemic in 2020, primarily due to the initial strict reactions (mainly January to May); the growth rates moderate in the later months of Q2 2021, and this continues in Q3
- The highest yoy growth rates were observed in India in April 2021, both in exports (+201.7% yoy) and imports (+166.6% yoy), the country most adversely affected in April 2020; the base effect is thus apparent and has to be taken into account in the correct interpretation of the data
- Only three states have already reported data for September 2021 - Brazil (+33.2% yoy in exports), China (2.65.2%) & South Korea (16.7%); the growth rates are positive but lower than observed in the preceding months (peak of the recovery), in line with our earlier expectations; the growth rates are at the same time, are higher in imports than in exports (except for China) - possibly indicating better customer expectations and thus more robust internal demand
- The growth rate of Chinese exports in July was the lowest since the beginning of the year - it picked up, however, in August and September; the period of elevated growth rates observed in trade over the strong recovery phase is over, and we enter a period of moderation
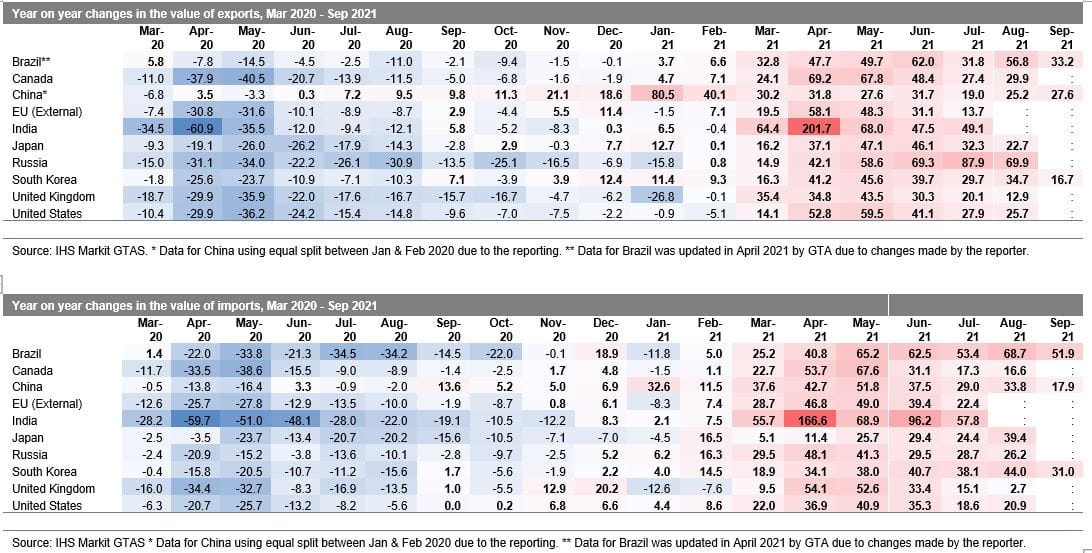
- If we compare the nominal value of exports to the last month preceding the global pandemic (Dec 2019), we see that in August 2021, all states reported higher export levels than in December 2019, apart from the UK; among the top 10, China recovered the fastest, although in relative terms, Brazil, reached the highest export levels, followed by India
Sectoral perspective
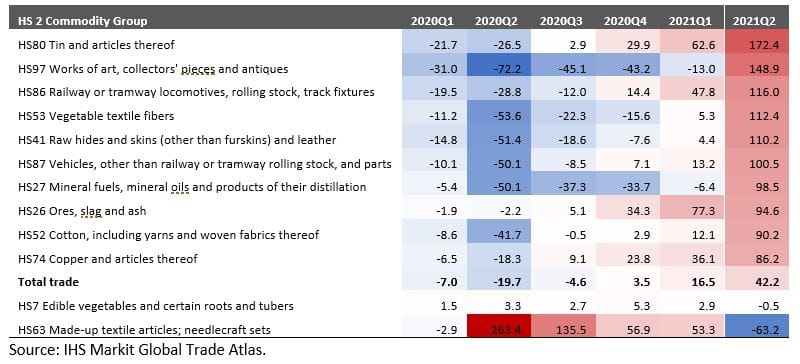
- The present section looks at the top 10 economies exports at the quarterly level at the HS two-digit commodities disaggregation level. We take into account the Q2 of 2021, Q3 data are not available yet for all top 10 states; please note that results differ slightly from the prior report due to data updates by reporting states
- The recovery in the top ten exports in Q2 2021 is present in nearly all the sectors except for made-up textiles and edible vegetables (negative yoy growth rates in Q2, the commodity group seems to behave countercyclically).
The full version table with sectoral breakdown for all HS2 codes is avilable to our Global Trade Analytics Suite(GTAS) clients only on Connect platform. Contacts IHS Markit Customer Care Customer.Care@ihsmarkit.com for details.
- The sectors with the highest growth yoy in Q2 2021 were tin and articles thereof, works of art, collectors' pieces and antiques, railway or tramway locomotives, rolling stock, track fixtures, vegetable textile fibers, rawhides, and skins (other than furskins) and leather as well as vehicles
- In most sectors, recovery started already in Q3 2020, and then the number of recovering sectors increased from quarter to quarter
- Overall, Q4 2020 brought a general recovery (+3.5% yoy), and Q1 2021 generated the foreseen boost to top 10 exports (+16.5% yoy), followed by even more impressive growth in Q2 2021 (+42.2% yoy). We expect the growth to be more moderated in yoy terms in Q3 & Q4 of 2021
Prospects for the Forthcoming Months
COVID-19
- The cumulative number of confirmed cases of COVID-19 globally by 24 October 2021 reached 243.7 million (and is likely to get 250 million cases threshold by November 2021) and 4.9 million deaths (to put in relative terms, it already surpassed the total population of Ireland)
- The 2-week moving averages of global new cases globally started to decline by mid-August 2021, with global average death rates following; the peak of the fourth wave is behind us, and the number of restrictions is subsiding; thus, the impact on global trade is weakening
- On a positive note, in comparison to prior waves, the increase in the number of cases seems not to have led to the rise of a similar magnitude increase in the number of reported deaths; it could be the strongly awaited impact of the mass vaccination programs
- In a recent news statement, WHO stated that the COVID-19 pandemic will last well into 2022
- The reported number of vaccinations globally reached 6.92 billion with 2.97 billion people fully vaccinated (with two doses or equivalent one dose), which is equal to 38.1% of the global population; to bust immunity, an increasing number of countries, primarily advanced, started to distribute the third dose mostly among the population aged 50+
PMI new export orders
- The adjusted PMI new exports orders (PMI NExO) readouts for the global manufacturing industry in September 2021 were above the benchmark value of 50.0 points (51.02) the 13th month in a row proving the sustained nature of recovery and still pointing to a positive short-term outlook for global trade; in comparison to August readouts its was higher by +0.04 only pointing to stabilization than a turnaround in the negative trend observed over the prior quarter
- The values for September were pointing to a positive short-term outlook for exports in six out of the top 10 economies with the highest values once again for the European Union (55.42), the United States (54.89), Canada (53.79); the values were below of 50.0 for in UK (49.70), Brazil (48.93), China (47.66) and once again for Russia (45.15) - 9th month in a row
- The readouts for October are by now available for the US (50.75), the UK (48.70), and Japan (51.00)
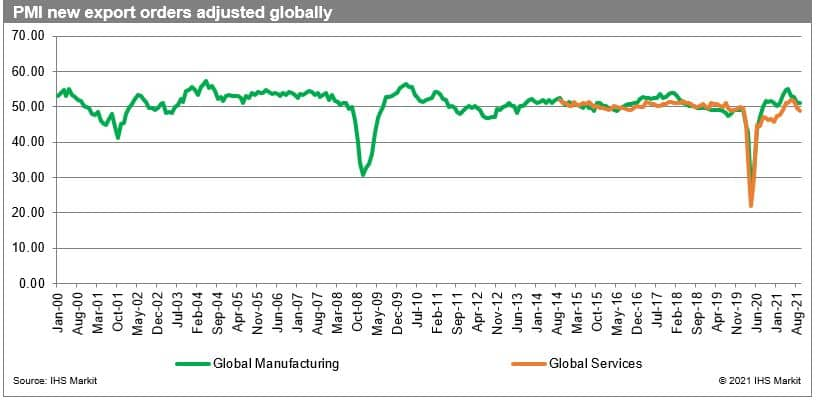
- PMI NExO in September 2021 for global manufacturing (51.02) is above of, and for global services is below the 50.0 points benchmark (48.81); PMI NExO for global services fell for the third month in a row, and the manufacturing PMI NExO stabilized after falling for a quarter
Transport costs
- Transport costs are still at very high levels, adversely affecting global trade flows. It is due to 6-7-year highs in crude oil and natural gas prices, excessive port congestion in many parts of the world, and COVID-19 related measures taken by some of the states
- The composite index of freight costs by the Shanghai Shipping Exchange exceeded 3300 points (USD/TEU), it started to flatten out or even fall on specific routes; please bear in mind that it was below 1000 for most of the time from 2015 to July 2020; the freight costs are unlikely to moderate in the next quarter
Real GDP forecasts
- The most recent real GDP growth forecasts from IHS Markit were published on 15 October 2021 and are based on the baseline scenario of the impact of COVID-19 on the global economy and the presence of increasing once-again GVCs disruptions
- The global recovery in 2021 is straightforward, with year-on-year real GDP growth rates now predicted to reach 5.5%. The growth rates are expected to vary between 4.9% (3.8% in 2022) for advanced, 6.5% (5.0%) for emerging, and 4.3% (5.0%) for developing states; the growth rates are further predicted to moderate to around 3% in 2026
- In comparison to the prior release from September, the growth prospects have been lowered for advanced economies both in 2021 and 2022 and increased for emerging and developing states
- The estimated growth rate in Q1 2021 was 3.4% and varied between -0.1% for advanced and 8.8% for emerging economies. In Q2 2021, real global GDP is estimated to have grown by 11.6%, with the growth impulse stronger for advanced (12.5%) than emerging economies (10.3%). The prospects for Q3 and Q4 are positive, with growth rates moderating to 4.1% and 5.3% in Q3 9 (4.2% and 3.2% respectively in Q4); starting from Q2 2022, growth in emerging states should start on a continuous basis exceed the growth in the group of advanced states
This column is based on IHS Markit Maritime & Trade Global Trade Atlas (GTA) & GTAS Forecasting data.
For more details about GTAS Forecasting, please visit the product page
https://ihsmarkit.com/products/gtas-forecasting.html
For further information about Global Trade Atlas (GTA), please visit the product page
https://ihsmarkit.com/products/maritime-global-trade-atlas.html
The full version of this article is available on the Connect platform for IHS Markit clients with a subscription to GTA/GTA Forecasting or GTAS Suite.
*Please note that China (mainland) reported an aggregated trade value for January-February 2020 - for the year 2020, the data in the GTA database were equally split between the two months. Brazil has revised data for 2020 affecting the reported growth rates.