Featured Topics
Featured Products
Events
S&P Global Offerings
Featured Topics
Featured Products
Events
S&P Global Offerings
Featured Topics
Featured Products
Events
S&P Global Offerings
Featured Topics
Featured Products
Events
Financial and Market intelligence
Fundamental & Alternative Datasets
Government & Defense
Banking & Capital Markets
Economy & Finance
Energy Transition & Sustainability
Technology & Innovation
Podcasts & Newsletters
Financial and Market intelligence
Fundamental & Alternative Datasets
Government & Defense
Banking & Capital Markets
Economy & Finance
Energy Transition & Sustainability
Technology & Innovation
Podcasts & Newsletters
ECONOMICS COMMENTARY — Feb 23, 2024
February's flash PMI surveys brought mixed news on inflation, with European prices looking stickier than in the US. The UK was also notable in seeing a greater incidence of supply chain delays, linked in part to Red Sea shipping disruptions, which is a potential harbinger of higher prices in the coming months.
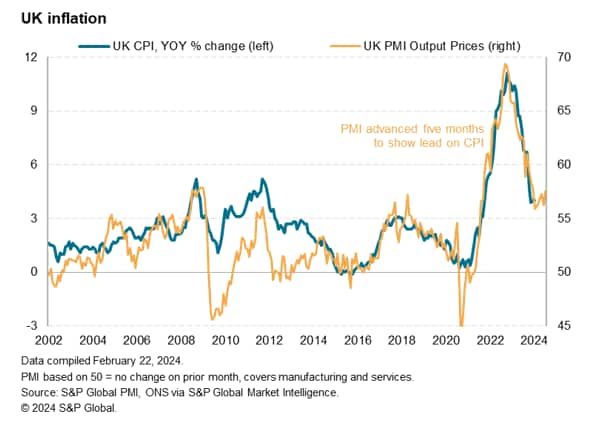
A key indicator of inflation is the PMI survey data relating to average prices charged for goods and services. While some of these goods and services are offered directly to consumers, notably the latter including many consumer-focused offerings such as meals, hotel accommodation, event tickets, haircuts and more, many are also sold to other companies, meaning the PMI price data act similarly to wholesale prices. As such, the PMI data tend to change before retail or high street prices, with retailers usually passing higher (or lower) supplier prices on after a delay. Hence the PMI data tend to exhibit their highest correlations with consumer price (CPI) inflation rates with leads ranging from 3-6 months.
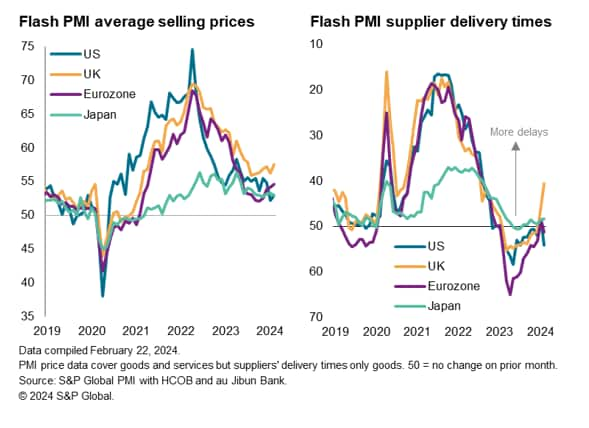
Looking at the latest data, the numbers from the United States are especially encouraging. Although the S&P Global PMI index of average prices charged for goods and services rose slightly according to February's provisional 'flash' reading, indicating a marginally faster rate of increase, the index remained low by historical standards. In fact, after January, February's reading of 52.9 was the lowest since June 2020.
Furthermore, historical comparisons suggest this latest reading is broadly indicative of annual consumer price inflation running at a 2% level, which is consistent with the US central bank's target.
The US survey data have provided a clear advance indication of US inflation surging during the pandemic, correctly signaling a peak in June 2022 and a subsequent rapid easing over the course of late-2022. After some stickiness was indicated around the 3% mark in 2023, the latest readings are an encouraging sign that inflation is cooling further to meet the FOMC's target.

The prices charged data for the eurozone PMI likewise correctly anticipated the peaking of inflation in 2022 and the subsequent steep decline, also hinting at some potential attainment of the central bank's 2% target. But recent months have seen the PMI index regain some ground, rising for a fourth month in February's flash survey to reach 54.6, a level well above that of the equivalent US index. Importantly, the latest reading is broadly indicative of consumer price inflation running close to the 3% level.

If the eurozone data are sending a disappointing signal to the European Central Bank, an even more worrying picture is presented by the UK PMI data. Here the average selling price index for goods and services rose in February to a four-month high of 57.5; according to the flash results, considerably higher than both the eurozone and the US.
At this level the UK index is signaling consumer price inflation around the 4% mark, double the Bank of England's 2% target. Having revived slightly from a low point seen last October, the data suggest that the strong disinflationary trend witnessed between 2022 and 2023 has ended.

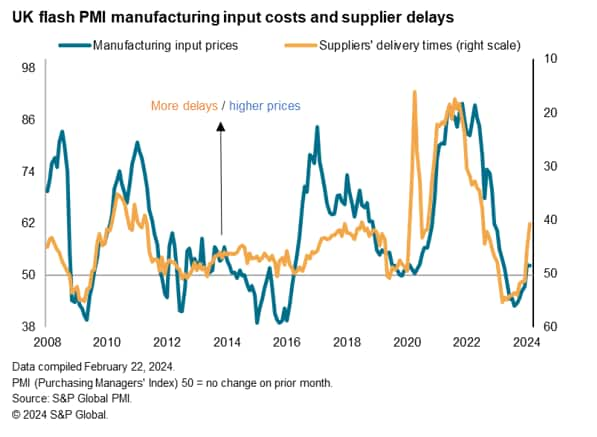
Adding to the UK's woes in February was a lengthening of supplier delivery times. The PMI Supplier Delivery Times Index is itself a valuable advance indicator of pipeline inflationary pressures ( read more about this index here). The flash February PMI surveys showed the highest degree of UK supply chain delays for over one-and-a-half years, linked to Red Sea shipping disruptions. Barring the pandemic, the lengthening of supplier delivery times was the second-greatest recorded over the past 13 years. The resulting increased cost of shipping contributed to an overall rise in factory input costs for a second successive month, which in turn fed through to the largest monthly rise in selling prices for goods seen over the past nine months.

By comparison, supplier delivery times quickened in both the US and Europe in February after having lengthened in January, suggesting far fewer supply chain incidents than in the UK and hinting that improved supply conditions will help soften prices further in their cases. This could potentially further widen the inflation differential between the UK, the US and Eurozone in the coming months.

Chris Williamson, Chief Business Economist, S&P Global Market Intelligence
Tel: +44 207 260 2329
© 2024, S&P Global. All rights reserved. Reproduction in whole or in part without permission is prohibited.
Purchasing Managers' Index™ (PMI®) data are compiled by S&P Global for more than 40 economies worldwide. The monthly data are derived from surveys of senior executives at private sector companies, and are available only via subscription. The PMI dataset features a headline number, which indicates the overall health of an economy, and sub-indices, which provide insights into other key economic drivers such as GDP, inflation, exports, capacity utilization, employment and inventories. The PMI data are used by financial and corporate professionals to better understand where economies and markets are headed, and to uncover opportunities.
This article was published by S&P Global Market Intelligence and not by S&P Global Ratings, which is a separately managed division of S&P Global.
Location
